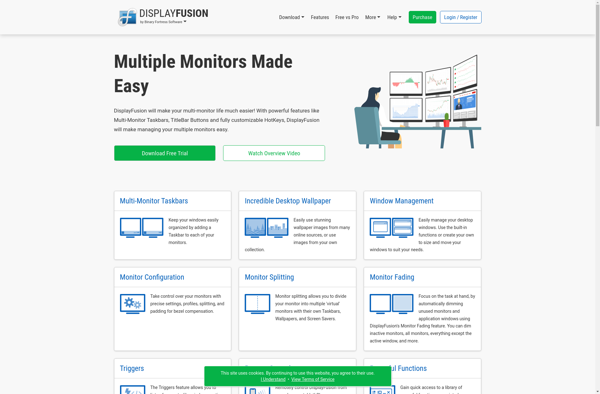
DisplayFusion
Description: DisplayFusion is a powerful software that helps manage multiple monitors on Windows. It enables snapping windows, creating custom layouts, setting backgrounds, organizing apps and tabs across screens.
Type: software
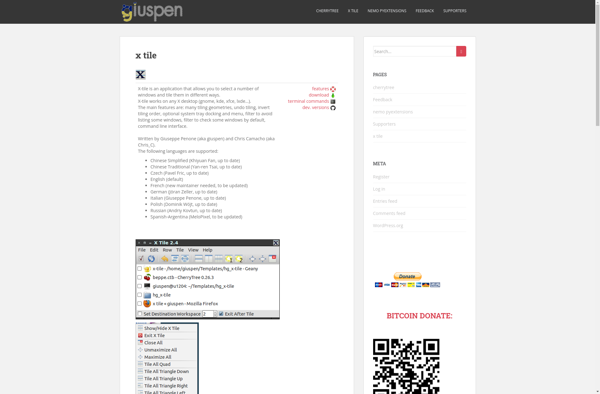
X-tile
Description: X-tile is data visualization software for presenting scientific data. It allows users to interactively view multiple grids of an image, chart, graph, or other visualizations side-by-side for comparison.
Type: software