X-tile
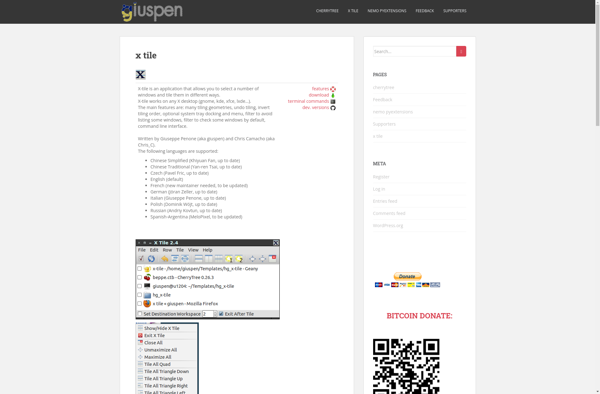
X-tile: Data Visualization Software
Data visualization software for presenting scientific data, allowing interactive comparison of multiple grids
What is X-tile?
X-tile is a versatile software tool developed at the Yale University School of Medicine for presenting scientific data in an interactive visualization grid format. It was originally created for viewing tissue microarrays in pathology research, but has expanded capabilities for visualizing any type of image, chart, graph, or other data.
The key feature of X-tile is that it allows users to divide a single visualization into multiple interchangeable grids so that different conditions, timepoints, treatments, etc. can be viewed side-by-side. For example, with an image set of tissue samples, different markers or stains could be shown for the same samples across multiple grids. Graphs can also be presented in the same manner showing how different variables change over time or conditions.
By synchronizing the different grids, X-tile creates an interactive exploratory data analysis tool. When a user highlights or selects certain data points in one grid, the corresponding data is highlighted across the other synchronized grids. This makes it easy to instantly visualize and pick out patterns across complex multivariate datasets.
The grids in X-tile can be filtered, sorted, and subgrouped dynamically, allowing users to investigate their hypotheses. Statistical tools are also integrated for analyzing the relationships between different variables. Altogether, X-tile improves efficiency and productivity for many research applications involving high-throughput data.
X-tile Features
Features
- Allows interactive viewing of multiple grids/panels side-by-side for comparison
- Can visualize data as heat maps, histograms, scatter plots, Kaplan-Meier plots
- Has point-and-click interface for selecting data ranges to visualize
- Integrates with Excel for data input
- Can annotate images and save/export visualizations
Pricing
- Free
- Open Source
Pros
Cons
Official Links
Reviews & Ratings
Login to ReviewThe Best X-tile Alternatives
Top Science & Engineering and Data Visualization and other similar apps like X-tile
Here are some alternatives to X-tile:
Suggest an alternative ❐DisplayFusion

SwitchResX

Ultramon

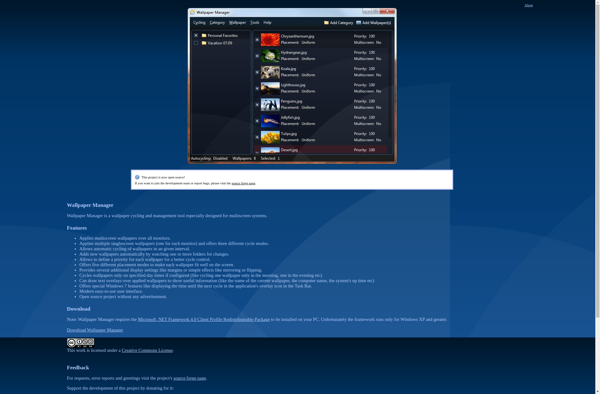
Wallpaper Manager
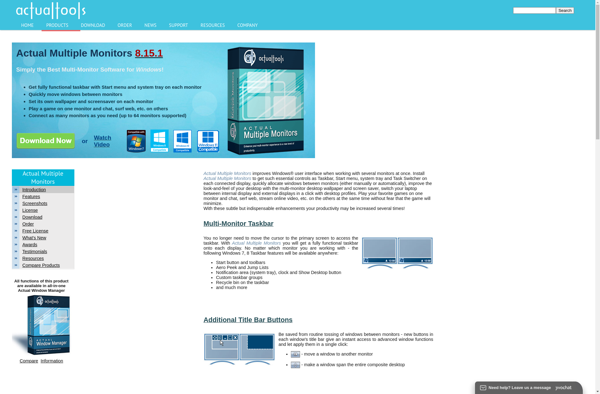
Actual Multiple Monitors
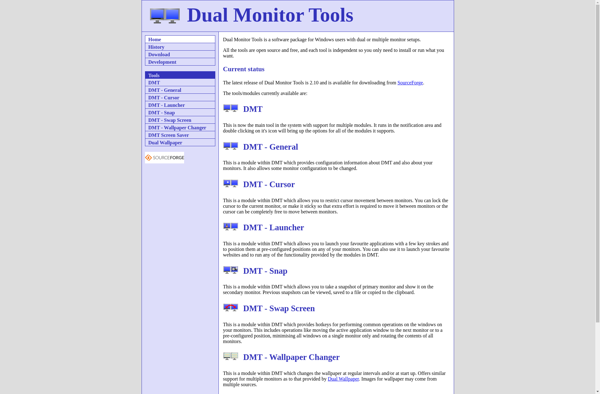
Dual Monitor Tools
ZBar
MultiMonitorTool

NVIDIA Quadro View

Superpaper

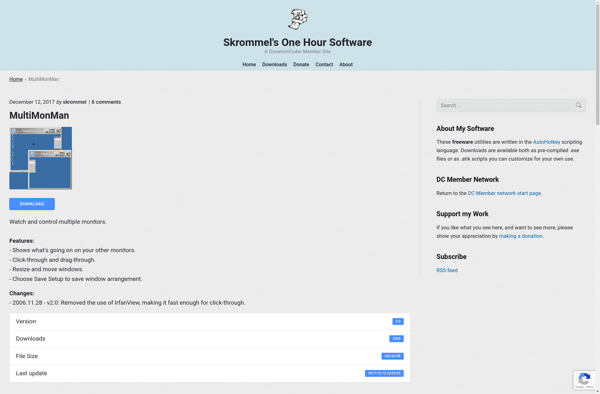
MultiMonMan
DisableMonitor

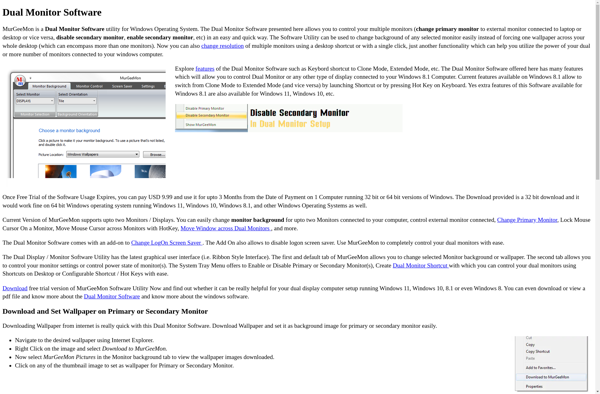
MurGeeMon
Instamonitr
