Cartogram is an open-source data visualization tool that allows users to create cartograms, which are maps that distort geography to portray data more accurately. It helps visualize quantitative information about geography in an intuitive way.
An open-source cartogram tool that distorts geography to portray data accurately, helping visualize quantitative info about geography in an intuitive way.
What is Cartogram?
Cartogram is an open-source data visualization application developed by the Cartogram team at Michigan State University. It allows users to create cartograms, which are maps that distort geography in order to better visualize quantitative information and statistics.
With Cartogram, users can upload a geospatial vector file such as a shapefile, choose an attribute to visualize such as population or economic data, and generate a cartogram where the shapes and sizes of geographic regions are resized in proportion to the data. This allows users to see spatial patterns and trends more clearly than a traditional map would allow.
Some key features and capabilities of Cartogram include:
Generating contiguous, non-contiguous, and Dorling cartograms from user uploaded files
Customizing cartogram colors, borders, labels, and other visual variables
Exporting cartograms as image files or PDF documents
Maintaining accurate spatial relationships even as geography is distorted
Intuitive and user-friendly interface requiring no coding skills
Cartogram helps journalists, researchers, educators, policymakers, and others visualize quantitative geospatial data more accurately and effectively. It is free and open-source software licensed under GPLv3.
Cartogram Features
Features
Allows users to create cartograms that distort geography to accurately visualize data
Open-source and available for free
Works with geographic information system (GIS) shapefiles
Customizable interface and styling
Can animate cartograms over time
Exports cartograms as images or SVG files
Command line interface available for advanced users
Google Maps is a web mapping platform and consumer application offered by Google. It offers satellite imagery, aerial photography, street maps, 360° interactive panoramic views of streets, real-time traffic conditions, and route planning for traveling by foot, car, bicycle and air, or public transportation.Key features of Google Maps include:Interactive street...
MapQuest is a free online mapping service launched in 1996 that provides users with driving directions, traffic conditions, route planning, and interactive maps. It was one of the first and most popular online mapping sites before the rise of Google Maps and Bing Maps.Key features of MapQuest include:Driving directions for...
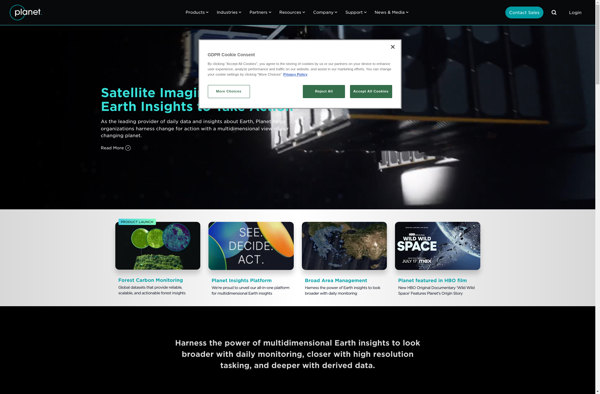
Planet Labs is an earth imaging company founded in 2010 and based in San Francisco, California. They operate the world's largest commercial satellite constellation with over 200 satellites in orbit, collecting imagery of the entire land mass of the Earth every day.Their high revisit rate and global coverage allows them...
Universal Maps Downloader is a free and open source software application that provides the ability to download map images from various popular online map services, including Google Maps, Bing Maps, OpenStreetMap, MapQuest, Yandex Maps, and more.Some key features of Universal Maps Downloader:Supports downloading map images at various zoom levels ranging...
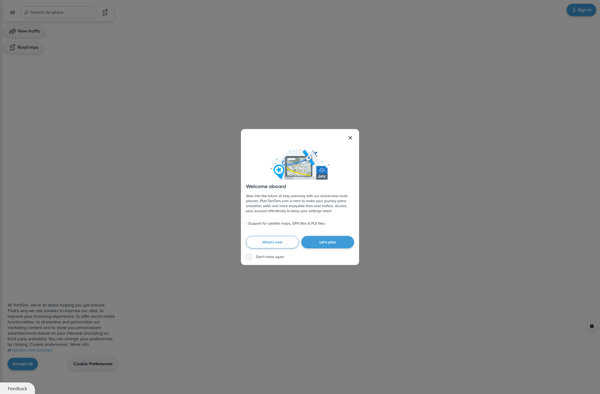
TomTom MyDrive is a free desktop and mobile app that interfaces with TomTom GPS navigation devices to provide expanded features and functionality. With MyDrive, users can plan routes and destinations on their computer, tablet, or phone and seamlessly send that information to their TomTom device.Key features of TomTom MyDrive include:Updated...
GPS Navigator is a feature-rich navigation and maps app for Android and iOS that is focused on providing accurate turn-by-turn directions even when offline. It sets itself apart by offering free offline map downloads for over 200 countries and territories worldwide, meaning you can navigate unfamiliar areas without racking up...
Google Maps Go is a streamlined version of the Google Maps app designed for Android Go edition devices. Android Go edition is a configuration of Android optimized for devices with less than 2GB of RAM, aimed at improving performance and accessibility in emerging markets.Some key features of Google Maps Go...
Mappy is an online and mobile map service mainly focused on Europe. It provides detailed street-level maps for over 40 European countries, covering popular travel destinations like France, Germany, Italy, Spain, and the UK as well as smaller countries across the region.Key features of Mappy include:Interactive maps with zoom, pan,...