COVID-19 Globe View is an interactive data visualization tool for exploring the global spread of COVID-19. It displays an animated 3D globe with heatmaps showing confirmed cases, deaths, and recoveries by country over time.
COVID-19 Globe View: Interactive Global COVID-19 Data Visualization
Explore the global spread of COVID-19 with a 3D animated globe featuring heatmaps of confirmed cases, deaths, and recoveries by country over time.
What is COVID-19 Globe View?
COVID-19 Globe View is an interactive web-based data visualization that allows users to explore the global spread of the COVID-19 pandemic. It features a 3D animated globe that visualizes confirmed cases, deaths, and recoveries by country over time using heatmaps.
As the timeline slider is adjusted, the heatmaps update to show the number of cases, deaths, and recoveries around the world on any given date. The intensity of the heatmap color indicates the severity according to the legend. Clicking on any country brings up a side panel with graphs showing the timeline of cases, deaths, and recoveries specifically for that country.
Additional options allow filtering by different metrics like confirmed cases or deaths per capita. The software allows easy exploration of how the COVID-19 pandemic has evolved globally as well as on a country-by-country basis over the course of 2020 and into 2021.
The interactivity and animation make trends and patterns in the data stand out very effectively. COVID-19 Globe View transforms complex public health data into an intuitive and engaging interactive visualization.
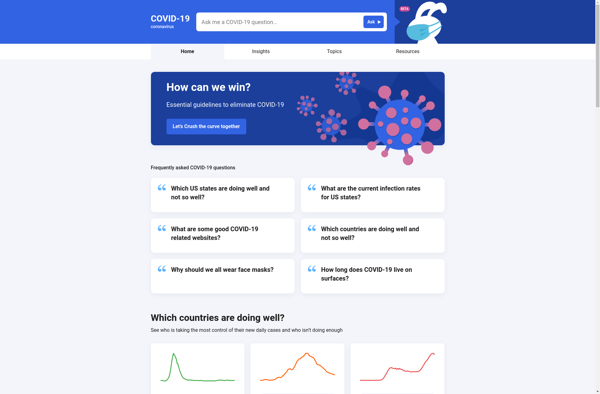
Ask About is a versatile customer service software solution that makes it easy for businesses to add an intelligent chatbot to their website. Here are some key features of Ask About:AI-powered conversational interface - The chatbot uses natural language processing to understand questions and provide relevant answers.Knowledge base integration -...
Corona Tracker is a mobile application available on iOS and Android that allows users to track the global spread of the COVID-19 pandemic. It provides real-time data and statistics on the total confirmed cases, recoveries, deaths, and rate of transmission for COVID-19 on a global scale as well as broken...
Covid Cards is a mobile app developed to serve as a digital vaccine passport during the COVID-19 pandemic. The app allows users to store verified records of their COVID-19 vaccination status and test results in one convenient place on their smartphone.After uploading evidence of vaccinations or tests, the records are...
CoronaStats is a free website and mobile app launched in 2020 to track the spread of COVID-19. It provides up-to-date statistics on confirmed coronavirus cases, deaths, recoveries, and tests performed for every country. The main feature is an interactive map showing case numbers by country, allowing users to easily see...
Coronavirus COVID-19 Global Cases is an interactive dashboard developed by the Center for Systems Science and Engineering (CSSE) at Johns Hopkins University to visualize and track the global spread of COVID-19. It provides a global view of the outbreak with tables, graphs, and maps showing confirmed cases, deaths, and recoveries...
A COVID-19 tracker is a software application that serves as an information hub about the latest COVID-19 pandemic statistics and news. COVID-19 trackers compile data from official health organizations and government sources to provide real-time updates on the spread of the SARS-CoV-2 virus.These trackers continuously monitor the number of confirmed...
CoronaWorld.net is a comprehensive website focused on the COVID-19 coronavirus pandemic. Launched in early 2020 at the start of the global outbreak, its goal is to serve as an authoritative source of information and guidance surrounding this developing situation.The site provides up-to-the-minute updates on case numbers, deaths, recoveries and more...
Coronavirus Tracker is a free website and mobile app launched in early 2020 to track the ongoing COVID-19 pandemic. It provides up-to-date statistics on total confirmed cases, deaths, recoveries, and active cases by country. The data is sourced from various health organizations and government agencies.Key features of Coronavirus Tracker include:Interactive...
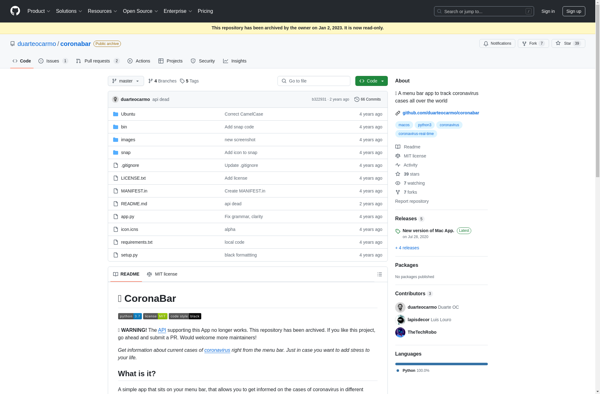
CoronaBar is a lightweight system monitor toolbar designed for the Windows operating system. It displays a compact overlay bar on top of your screen that makes it easy to monitor key system resources at a glance, including:CPU usage percentageRAM usage percentage and total RAM installedDisk usage percentage for all partitionsNetwork...
Just stay home is a productivity app designed to help people avoid unnecessary trips, outings, and errands by reminding them of what they already have available at home. The app allows users to log their pantry, freezer, and miscellaneous household items into an inventory system. Users can then easily browse...