EagleData
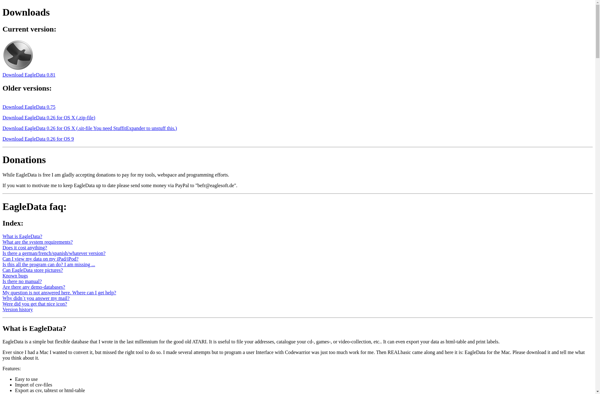
EagleData: Data Visualization & Business Intelligence Software
EagleData is a data visualization and business intelligence software that allows users to connect to various data sources, create interactive dashboards and reports, and share insights. It provides drag-and-drop functionality to build charts, graphs, and other visualizations easily.
What is EagleData?
EagleData is a versatile business intelligence and data visualization software used by organizations of all sizes to gain meaningful insights from their data. It provides an intuitive drag-and-drop interface to easily connect multiple data sources, including SQL and NoSQL databases, cloud apps, spreadsheets, and APIs.
With EagleData, users of any technical skill level can create interactive dashboards containing advanced charts, graphs, gauges, maps, and other visualizations to track KPIs and identify trends and patterns. Customizable templates allow dashboards to be tailored for different teams and use cases while collaboration features enable secure dashboard sharing to relevant stakeholders.
The software comes equipped with a calculation editor to add advanced logic and scripting to visualizations when needed. Row-level security, dynamic filtering, and integration with enterprise authentication systems safeguard data integrity and access. Automated alerts and scheduled reports allow key metrics to be monitored and delivered to inbox on a regular basis.
EagleData enables self-service BI by providing analysts, managers, and senior leadership with timely visual-based insights into organizational data. This drives more informed strategic planning and decision making across the enterprise. With an intuitive interface optimized for business users, EagleData democratizes data access and analytics.
EagleData Features
Features
- Drag-and-drop interface to build dashboards
- Connects to various data sources like SQL, MongoDB, REST APIs
- Interactive visualizations including charts, graphs, gauges, maps
- Collaboration tools to share dashboards and insights
- Alerts and scheduled reports
- Pixel-perfect dashboard printing
- REST API and SDKs for developers
Pricing
- Freemium
- Subscription-Based
Pros
Cons
Reviews & Ratings
Login to ReviewThe Best EagleData Alternatives
Top Business & Commerce and Business Intelligence & Analytics and other similar apps like EagleData
Here are some alternatives to EagleData:
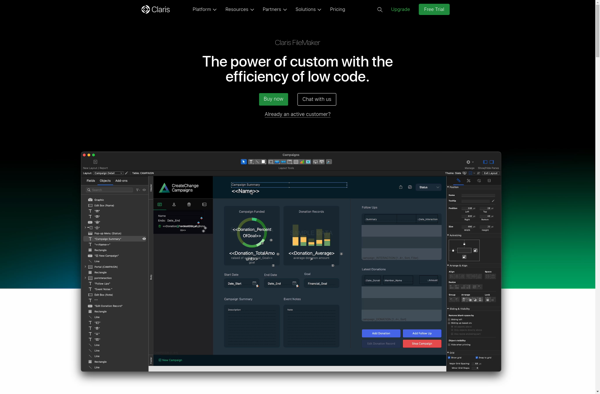
Suggest an alternative ❐Claris FileMaker
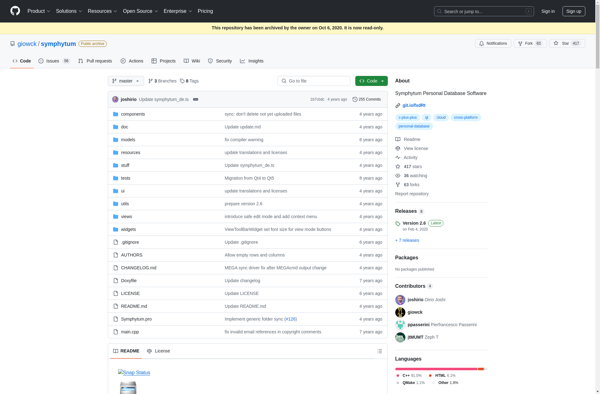
Symphytum
Cellica Database

MUIbase
PortaBase
SnapDB
Dabitat

MDBLite
