Esignal

Esignal

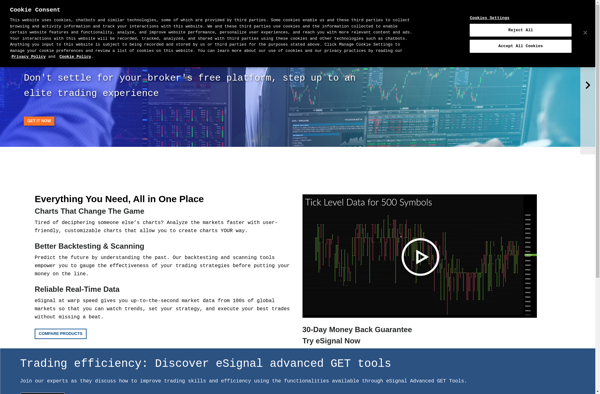
Esignal is a technical analysis software platform aimed at active traders and investors. It allows users to analyze financial markets with charting tools, scanning capabilities, trading systems development, and data feeds of multiple asset classes.
Esignal image
charting technical-analysis trading stocks forex futures

Esignal: Technical Analysis Software Platform

Esignal is a technical analysis software platform aimed at active traders and investors. It allows users to analyze financial markets with charting tools, scanning capabilities, trading systems development, and data feeds of multiple asset classes.

What is Esignal?

Esignal is a desktop and web-based software platform designed for traders who actively analyze financial markets and execute trades. First launched in 1983, Esignal provides tools for technical analysis, automated trading strategies development, backtesting, scanning, charting across multiple asset classes including stocks, futures, forex, options, and cryptocurrencies.

Key features of Esignal include:

  • Charting – Customizable interactive charts with 100+ technical indicators for analyzing price movements and trends.
  • Alerts – Price, indicator, news and event-based alerts for tracking trading opportunities.
  • Scanning – Prebuilt and customizable scans to search for stocks and other assets meeting specific technical criteria.
  • Strategy Backtesting – Develop and test automated trading systems across historical data without risking real money.
  • Trading – Native brokers integrations and API for order execution from within platform.
  • Customization – Scripting language for indicators, strategies, columns, scans and more to suit individual workflow.
  • Data Feeds – Real-time, streaming data for global markets including NASDAQ, NYSE, CME, BATS and international exchanges.

Esignal aims to provide sophisticated tools for analysts while maintaining intuitive interface for rapidly analyzing markets and acting on opportunities. Frequent updates and focus on customer requirements continues to endear it to demanding traders and technical analysts over decades.

Esignal Features

Features

  1. Real-time streaming quotes and charts
  2. 100+ technical indicators
  3. Advanced charting with customizable layouts
  4. Built-in scanning for trade opportunities
  5. Automated trading system development and backtesting
  6. News and economic data feeds
  7. Portfolio tracking and analysis
  8. Mobile and web trading platforms

Pricing

  • Subscription-Based

Pros

Powerful charting and analysis capabilities

Customizable layouts and indicators

Automated scanning helps find trading opportunities

Tools for building and testing trading strategies

Supports trading multiple asset classes

Available on desktop, web and mobile

Cons

Expensive compared to other platforms

Steep learning curve

Data feeds require additional purchase

Limited customization options for indicators

Mobile apps lack some advanced features


The Best Esignal Alternatives

Top Finance and Trading Platform and other similar apps like Esignal


CityFALCON icon

CityFALCON

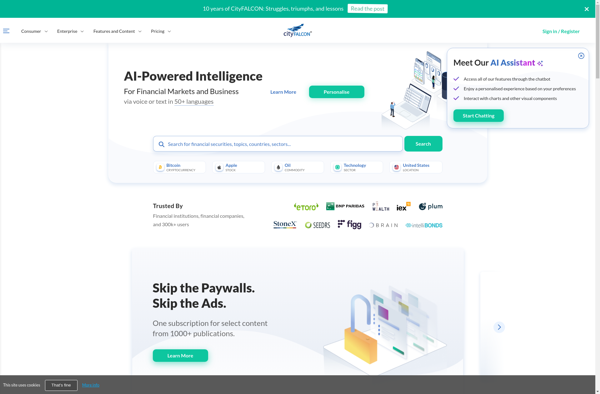
CityFALCON is a financial technology company that has developed a platform to deliver personalized financial news, data, and content to investors. The company was founded in 2014 in London by a team with backgrounds in finance, technology, and data science.The CityFALCON platform uses artificial intelligence, machine learning, and natural language...
CityFALCON image
Ninjatrader icon

Ninjatrader

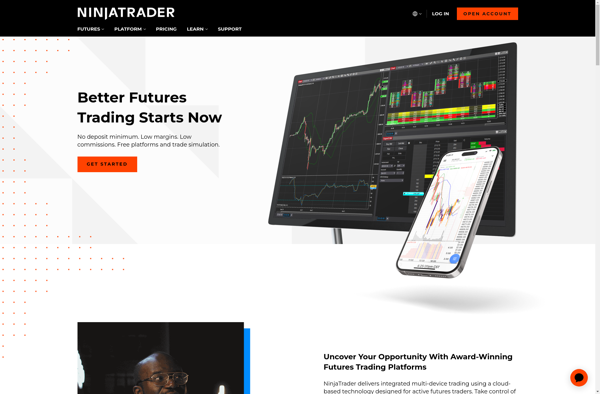
Ninjatrader is a feature-rich trading platform developed by NinjaTrader Group, LLC specifically for active futures and forex traders. It supports both manual and automated trading through an easy-to-use interface. Some of the key features of Ninjatrader include:Advanced charting and market analytics tools for technical analysisBuilt-in market replay and backtesting functionalitySupport...
Ninjatrader image
Sierra Chart icon

Sierra Chart

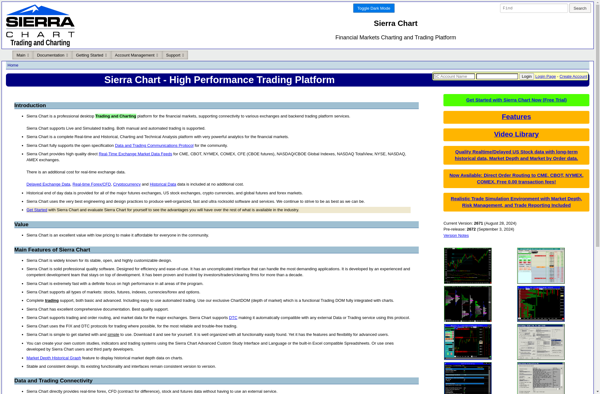
Sierra Chart is a robust and feature-rich platform for analyzing financial market data and executing trades. It is targeted at active traders and offers advanced charting and customization options for tracking equities, futures, forex, and other asset classes.Some key features of Sierra Chart include:Support for high-performance market data and order...
Sierra Chart image
Google Finance icon

Google Finance

Google Finance is a website and online financial tool provided by Google to track stocks, bonds, mutual funds and other investments. It provides real-time market data for free and serves as a gateway for users to do research on financial products and make informed investment decisions.Some key features of Google...
Google Finance image
Stockfolio icon

Stockfolio

Stockfolio is a user-friendly, feature-rich web application aimed at helping individual investors efficiently track, analyze, and manage their stock investment portfolios. It allows users to:Add multiple portfolios and input buy/sell transactions including commissionsGet real-time stock quotes and interactive chartsView detailed performance analytics on the portfolio, positions, and asset allocationsSet price...
QCharts icon

QCharts

QCharts is an open-source data visualization library designed specifically for use in Qt applications. It provides an easy way for developers to incorporate interactive charts, graphs, and other data visualization components into their Qt-based desktop, mobile, and embedded applications.Some of the key features and capabilities of QCharts include:A wide variety...