Gaio Analytics Platform is an all-in-one business intelligence and analytics solution for tracking KPIs, visualizing data, and generating insights. It allows users to consolidate data from multiple sources to monitor performance.
Gaio Analytics Platform: All-in-One Business Intelligence Solution
Gaio Analytics Platform is an all-in-one business intelligence and analytics solution for tracking KPIs, visualizing data, and generating insights. It allows users to consolidate data from multiple sources to monitor performance.
What is Gaio Analytics Platform?
Gaio Analytics Platform is a powerful business intelligence and analytics solution designed to help companies make data-driven decisions. It provides an intuitive, customizable interface to track key performance indicators (KPIs), create interactive dashboards and reports, and gain actionable insights.
Key features of Gaio Analytics Platform include:
Data consolidation from multiple sources like databases, cloud apps, etc. into a unified view
Pre-built dashboards and KPI templates for sales, marketing, support, and more
Ad hoc analysis with drag-and-drop functionality to visualize data
Interactive reports that can be scheduled, shared and exported in a variety of formats
Predictive analytics capabilities powered by machine learning algorithms
Flexible API for embedding analytics and integrating with other platforms
Role-based access control and enterprise-grade security
With robust data exploration tools, customizable dashboards, and AI-driven insights, Gaio empowers businesses to optimize decisions, uncover growth opportunities, and improve overall performance.
R is an open-source programming language and free software environment for statistical computing, bioinformatics, graphics, data science, and general-purpose programming. The R language provides a wide variety of statistical analysis techniques and graphical capabilities which make it a popular choice for data analysis and visualization.Some key features of R include:Open-source...
IBM SPSS Statistics is a comprehensive software platform for statistical analysis in business, science, and social science research. First released in 1968, SPSS Statistics helps users apply complex statistical analyses and predictive analytics to unlock impactful insights from data.Key features and capabilities of SPSS Statistics include:Descriptive statistics like means, standard...
RStudio is a popular open-source IDE for R, a programming language for statistical computing and graphics. It provides a user-friendly graphical user interface that makes working with R much easier by integrating tools for plotting, debugging, workspace management, and other features.Some key features of RStudio include:Code editor with syntax highlighting,...
KNIME is an open-source software platform used for advanced data analytics, reporting, and integration. It provides a user-friendly graphical workflow editor that allows users to create data pipelines by connecting different processing nodes. KNIME aims to speed up the process of obtaining insights from data.Some key features and capabilities of...
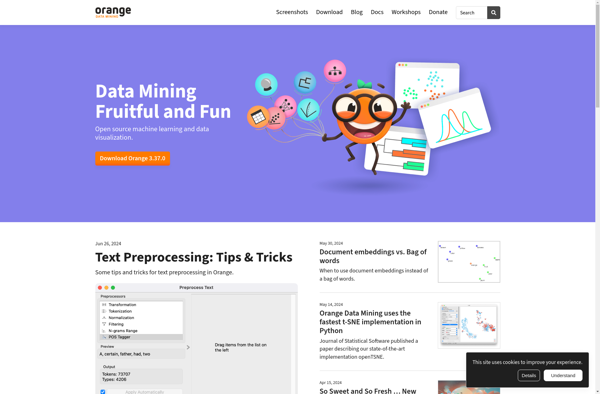
Orange is an open-source data visualization and machine learning toolkit developed at the University of Ljubljana in Slovenia. It features a visual programming interface for exploratory data analysis, data mining, and machine learning. Orange allows users to load datasets, manipulate data, construct workflows visually with drag-and-drop components, and apply common...
Altair RapidMiner is a comprehensive data science software platform used by organizations for data preparation, machine learning, deep learning, text mining, and predictive analytics. It provides a visual, drag-and-drop interface to quickly build, test, deploy, and manage advanced analytic workflows and machine learning models.Key capabilities include:Data preparation tools for cleaning,...
ANKHOR FlowSheet is a flexible workflow automation platform designed specifically for hospitals and healthcare delivery organizations. It enables users to easily build and deploy digital forms, multi-step workflows, real-time alerts and notifications, reports, and dashboards to streamline clinical, financial, and operational processes.Some key features and benefits of ANKHOR FlowSheet include:Drag-and-drop...
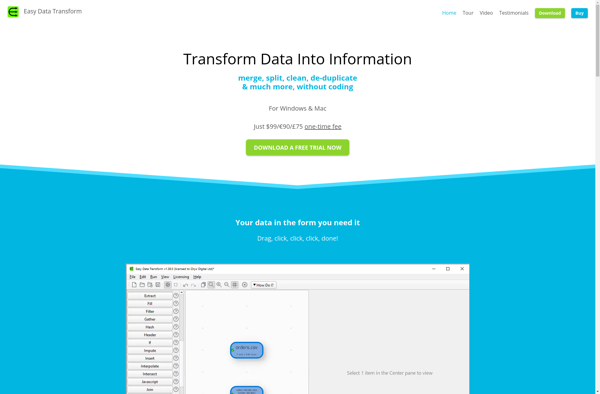
Easy Data Transform is a powerful yet intuitive desktop application for data transformation, cleaning and manipulation. It works on Windows, Mac and Linux operating systems.With its easy-to-use graphical interface, you can quickly combine, compare, validate, modify, split, filter, aggregation or perform other operations on multiple data sources like CSV, JSON,...
SIMON is an open-source, cross-platform speech recognition software that allows users to control their computer and applications using voice commands. Developed by VConnecting Services Inc., SIMON aims to provide an accessible hands-free computing experience.Some key features of SIMON include:Ability to launch apps, open files, browse the web, and more using...
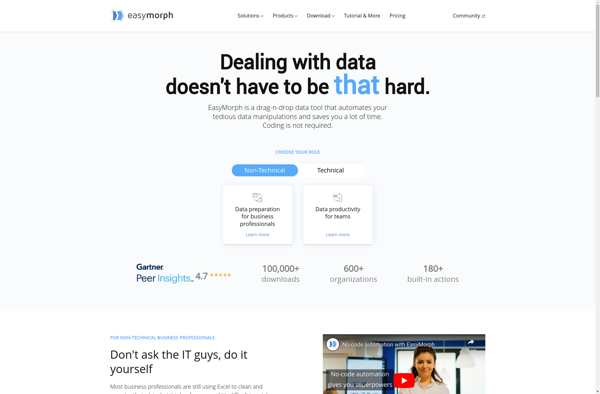
EasyMorph is a versatile data transformation and ETL (extract, transform, load) desktop application used by both technical and non-technical users. It provides a visual, no-code interface for quickly combining, cleaning, and reshaping data from various sources like Excel, CSV files, databases and other applications and loading it into destination files...
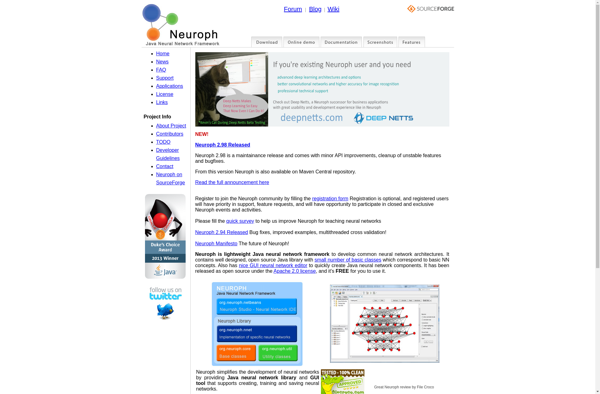
Neuroph is an open-source Java neural network framework used to develop common neural network architectures like multilayer perceptrons, convolutional neural networks, and more. It aims to provide a well-designed, easy to use Java library for neural network development and training.Some key features of Neuroph include:Implementations of common neural network architectures...
Neural Designer is a software that enables development, simulation, and deployment of neural networks models for creating intelligent systems. It uses deep learning algorithms and techniques for fast creating accurate predictive models from large amounts of data. Key capabilities and features:Intuitive visual interface to design neural networks with drag-and-drop using...
GMDH Shell is an open-source software application for data mining and machine learning tasks. It provides a user-friendly graphical interface for building predictive models using GMDH-type neural networks.Some key features and capabilities of GMDH Shell include:Intuitive visual interface for working with datasets and building GMDH modelsWide range of data visualization...
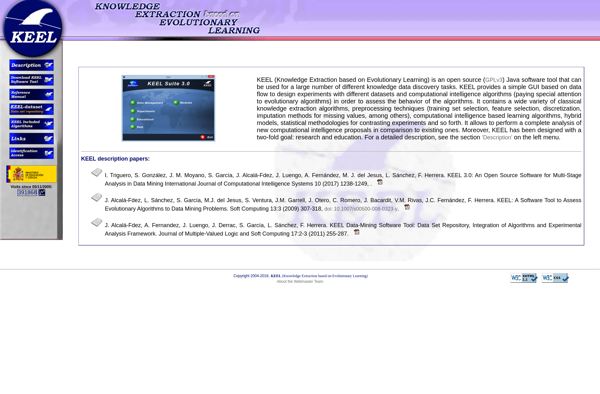
KEEL is an open-source tool for automating Kubernetes deployment updates and rollbacks. It aims to reduce management overhead and minimize errors when updating applications running on Kubernetes.KEEL continuously monitors Kubernetes resources like Deployments, StatefulSets, DaemonSets, and Helm Releases. Based on policies defined by the user, KEEL will automatically perform tasks...
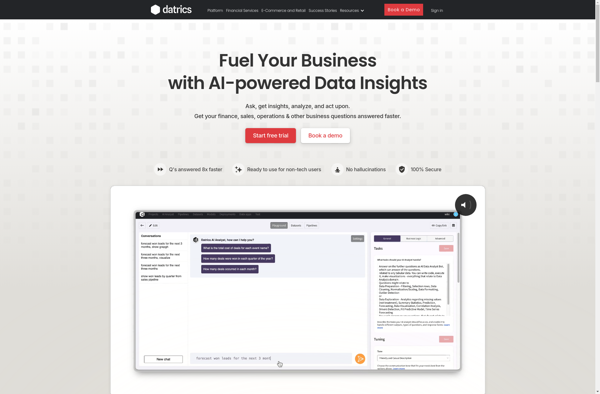
Datrics is a powerful data analytics and business intelligence platform designed to provide deep insights into website traffic, user engagement, and customer behavior. It is an all-in-one solution for digital analytics and optimizing online business performance.Key features of Datrics include:Customizable dashboards and reports to visualize traffic metrics, user flows, conversions,...
QIWare is an open-source business process management and workflow automation software designed to help organizations streamline operations, increase efficiency, and improve productivity. It provides a flexible no-code platform for creating, automating, managing, optimizing, and analyzing business processes and workflows.Key features of QIWare include:Intuitive drag-and-drop interface for building workflows visuallyPre-built templates...