Graphical Ping

Graphical Ping: Free Network Ping Tool
A free, open source software tool for Windows providing a graphical interface for pinging devices on a network, allowing easy device pings, graph view, and customizable ping settings.
What is Graphical Ping?
Graphical Ping is a free, open source network diagnostic utility for Windows that provides a graphical user interface for pinging devices on a local network or the internet. It was created to be an easy way for both novice and advanced computer users to visually see ping responses and latency.
Some of the key features of Graphical Ping include:
- Graphically displays ping responses over time so you can easily identify connection problems
- Lets you easily adjust ping settings like timeout, buffer size, TTL, and more
- Supports pinging by hostname or IP address
- Allows pinging multiple devices concurrently
- Export ping logs and graphs for reporting or documentation
- Customizable interface colors and themes
- Free and open source software
Unlike the standard Windows command line ping utility, Graphical Ping provides visual graphs and customization options to make it easier to troubleshoot network connectivity issues or monitor latency. Its simple interface allows both basic and more advanced users to understand connection quality at a glance.
Some examples of how Graphical Ping can be used include: troubleshooting why a website or server is slow or timing out, testing network device configurations, getting visual latency metrics to ISPs or web services, documenting connection problems for IT support, or better understanding network topology latency.
In summary, Graphical Ping is an easy yet powerful network diagnostic utility for pinging devices on Windows and visually analyzing the results over time. Its combination of a simple interface plus advanced features makes it valuable for a wide range of connectivity testing and monitoring scenarios.
Graphical Ping Features
Features
- Graphical interface for pinging devices
- View ping responses in a graph
- Customizable ping settings
- Save/load ping sessions
- Export ping data
- Ping multiple devices
Pricing
- Free
- Open Source
Pros
Cons
Official Links
Reviews & Ratings
Login to ReviewThe Best Graphical Ping Alternatives
View all Graphical Ping alternatives with detailed comparison →
Top Network & Admin and Network Monitoring and other similar apps like Graphical Ping
Here are some alternatives to Graphical Ping:
Suggest an alternative ❐Multiping

PingInfoView

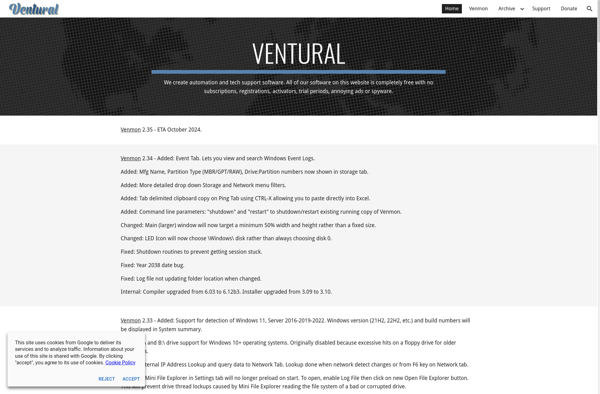
Venmon
Ping Meter Gadget

Internet Connectivity Monitor

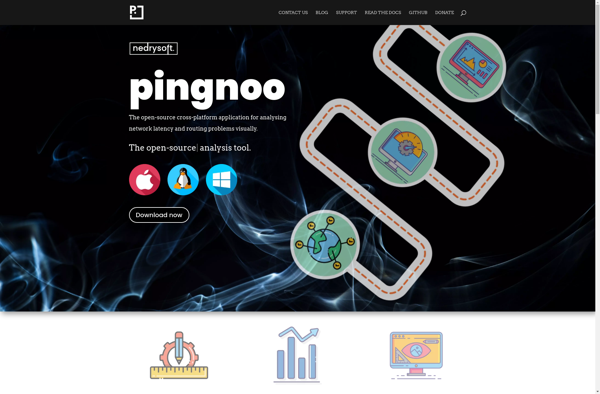
Pingnoo
Is Down For Everyone (or Just Me)
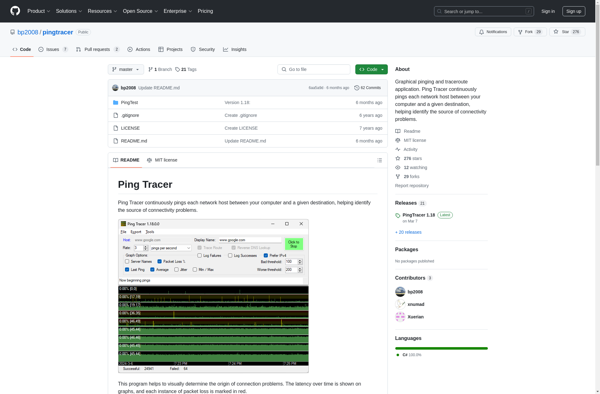
Ping Tracer
Down for me or everyone?
Downinspector.com
UPDOWNTODAY

Site Panic
Open Visual Traceroute
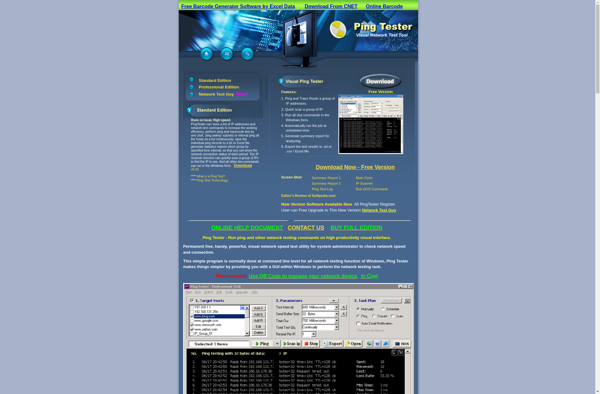
PingTester