JConsole is a graphical monitoring tool that comes bundled with the Java Development Kit (JDK). It allows developers to monitor Java applications in real-time and troubleshoot issues like memory leaks, high CPU usage, and stuck threads.
JConsole: Graphical Monitoring Tool for Java Applications
A bundled tool with the JDK, JConsole monitors Java apps in real-time, detecting issues like memory leaks, high CPU usage & stuck threads.
What is JConsole?
JConsole is a graphical monitoring and management console included in the Java Development Kit (JDK) for monitoring and managing Java applications while they are running. It enables developers to monitor, troubleshoot, and profile Java applications and virtual machines in real-time.
Some key features of JConsole include:
Monitoring memory usage including heap memory, permanent generation memory, and memory pools
Monitoring threads including current threads, deadlocked threads, and thread contention
Monitoring classes including class loading, unloading, and memory usage
Viewing VM summary information like VM version, uptime, class count, and compilation time
Generating thread dumps and heap dumps for analysis
Profiling CPU and memory usage to identify bottlenecks
Monitoring MBeans to track custom application metrics
JConsole provides powerful insight into the runtime behavior of Java applications which helps developers tune performance, analyze memory leaks, track down excessive CPU usage, debug stuck threads, and understand overall application health. Its GUI makes it easy to understand visual representations of an application's metrics versus sifting through textual log files or data.
JConsole Features
Features
Real-time monitoring of JVM statistics like memory usage, thread counts, class loading
Monitoring of MBeans - objects that expose management interfaces
Thread monitoring and profiling
Heap dump and heap histogram generation
VM telemetry and notifications
Remote monitoring of Java applications
Pricing
Free
Pros
Bundled with JDK - no additional setup required
Lightweight and easy to use graphical interface
Good for basic monitoring and troubleshooting
Can connect to remote JVMs for monitoring
Cons
Limited features compared to advanced profiling tools
Cannot monitor non-JVM processes
No API for automation
UI can be slow to refresh when monitoring busy systems
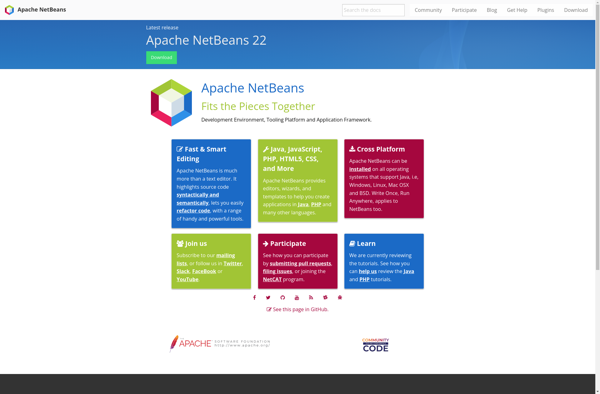
<p>Apache NetBeans is a free and open source integrated development environment focused primarily on developing Java applications. It runs on most operating systems including Windows, Linux and macOS. Key features include:</p><ul><li>Support for developing Java SE, Java ME, Java EE/Jakarta EE and JavaFX applications</li><li>Integrated development tools for HTML5, PHP, JavaScript and...
JProfiler is a professional and feature-rich Java profiler used to analyze CPU and memory usage of Java applications at code level. It helps developers identify performance bottlenecks and optimize application speed and stability.Key features of JProfiler include:CPU profiling to find hottest methods and code blocks that consume most CPU timeMemory...
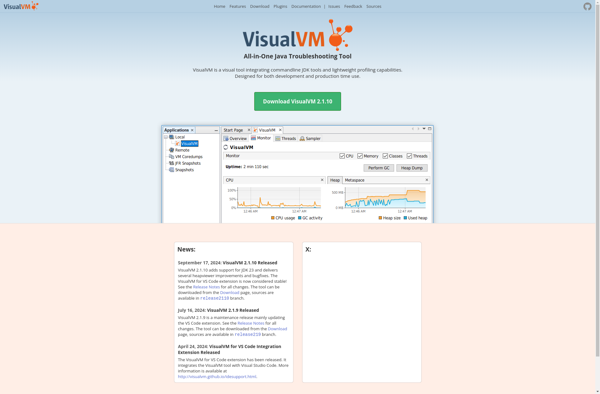
VisualVM is a versatile performance monitoring and profiling tool for Java applications. It is designed to help developers optimize, troubleshoot, and understand the runtime behavior of their Java code.Some key features of VisualVM include:Monitoring memory usage, CPU utilization, threads and other statistics for Java applicationsPerforming CPU and memory profiling to...
OpenBeans is an open-source accounting and bookkeeping software designed as an alternative to QuickBooks. It provides a suite of features targeted at small businesses to help manage their finances and accounting.Some of the key features of OpenBeans include:Easy to use graphical interface for managing general ledger, accounts payable/receivable, invoicing, billing,...
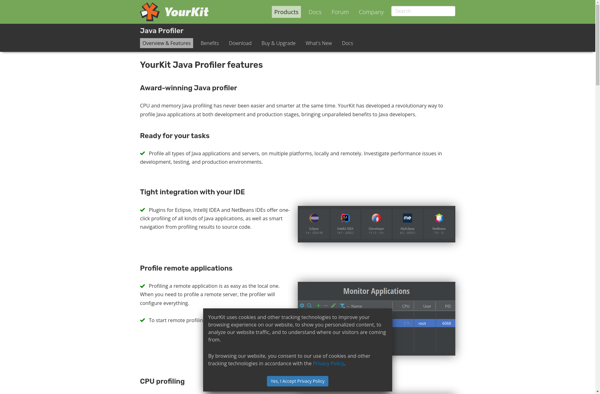
YourKit Java Profiler is a powerful profiling tool designed specifically for Java applications. It allows developers to analyze and optimize the performance of Java code in a visual, intuitive manner.Some key features of YourKit Java Profiler include:CPU and memory profiling to identify hotspots, leaks, and inefficient data structuresThread profiling to...
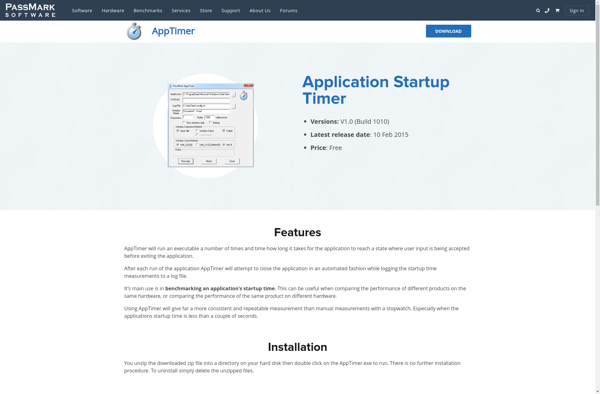
AppTimer is a comprehensive time tracking and productivity software designed to help professionals, freelancers, consultants, and small teams track their time accurately, monitor productivity, and bill clients easily. It provides the following key features:Intuitive manual time tracking with running timers to capture real-time work information and ensure accurate time logsIdle...
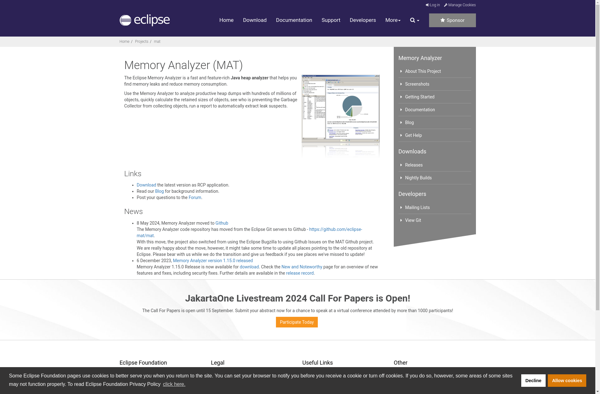
Eclipse Memory Analyzer (MAT) is an open-source tool designed for analyzing Java heap memory usage, finding memory leaks, and minimizing memory consumption. It is commonly used for optimizing and troubleshooting memory problems in Java applications.MAT provides several key features for memory analysis including:Heap dumping - MAT can analyze heap dump...