JProfiler
JProfiler is a Java profiler that helps developers optimize the performance of Java applications. It provides CPU, memory, and thread profiling to identify performance bottlenecks and memory leaks.
JProfiler: Java Profiler for Optimizing Application Performance
JProfiler helps developers optimize Java application performance with CPU, memory, and thread profiling to identify bottlenecks and leaks.
What is JProfiler?
JProfiler is a professional and feature-rich Java profiler used to analyze CPU and memory usage of Java applications at code level. It helps developers identify performance bottlenecks and optimize application speed and stability.
Key features of JProfiler include:
- CPU profiling to find hottest methods and code blocks that consume most CPU time
- Memory profiling to detect memory leaks and identify largest objects in the heap
- Thread profiling to analyze thread activity and monitor contention
- Built-in telemetry to monitor applications in production without overhead
- Integration with popular Java IDEs like Eclipse, IntelliJ and NetBeans
- Supports profiling of desktop, client-server and web applications
- Can profile applications running on JEE application servers
With its low overhead, non-intrusive design and impressive profiling capabilities, JProfiler is a great choice for developers and architects looking to optimize Java application performance and scalability.
JProfiler Features
Features
- CPU profiling
- Memory profiling
- Thread profiling
- Identification of performance bottlenecks
- Identification of memory leaks
- Supports various Java runtimes and application servers
- Customizable profiling views
- Supports remote profiling
- Supports Java 9 and later versions
Pricing
- Subscription-Based
Pros
Comprehensive profiling capabilities
Easy to use interface
Detailed analysis of performance issues
Supports a wide range of Java applications
Provides useful recommendations for optimization
Cons
Can be resource-intensive during profiling
Requires a paid license for advanced features
Limited support for older Java versions
Reviews & Ratings
Login to ReviewThe Best JProfiler Alternatives
View all JProfiler alternatives with detailed comparison →
Top Development and Java Development and other similar apps like JProfiler
Here are some alternatives to JProfiler:
Suggest an alternative ❐VisualVM
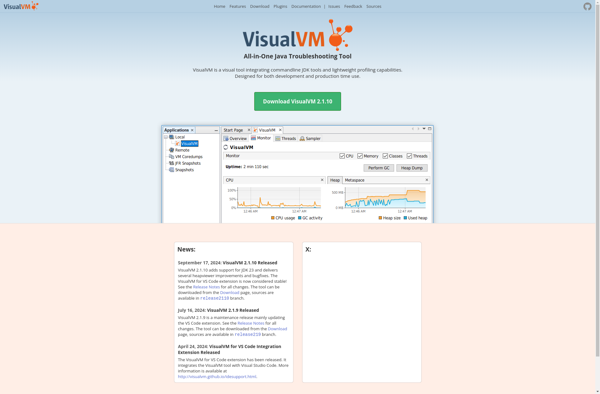
VisualVM is a versatile performance monitoring and profiling tool for Java applications. It is designed to help developers optimize, troubleshoot, and understand the runtime behavior of their Java code.Some key features of VisualVM include:Monitoring memory usage, CPU utilization, threads and other statistics for Java applicationsPerforming CPU and memory profiling to...
OpenBeans
OpenBeans is an open-source accounting and bookkeeping software designed as an alternative to QuickBooks. It provides a suite of features targeted at small businesses to help manage their finances and accounting.Some of the key features of OpenBeans include:Easy to use graphical interface for managing general ledger, accounts payable/receivable, invoicing, billing,...

JConsole
JConsole is a graphical monitoring and management console included in the Java Development Kit (JDK) for monitoring and managing Java applications while they are running. It enables developers to monitor, troubleshoot, and profile Java applications and virtual machines in real-time.Some key features of JConsole include:Monitoring memory usage including heap memory,...
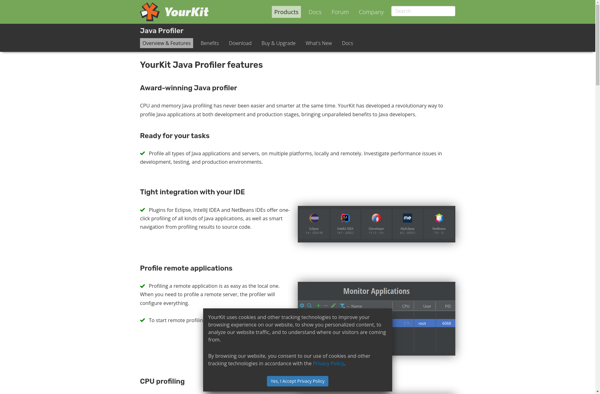
YourKit Java Profiler
YourKit Java Profiler is a powerful profiling tool designed specifically for Java applications. It allows developers to analyze and optimize the performance of Java code in a visual, intuitive manner.Some key features of YourKit Java Profiler include:CPU and memory profiling to identify hotspots, leaks, and inefficient data structuresThread profiling to...
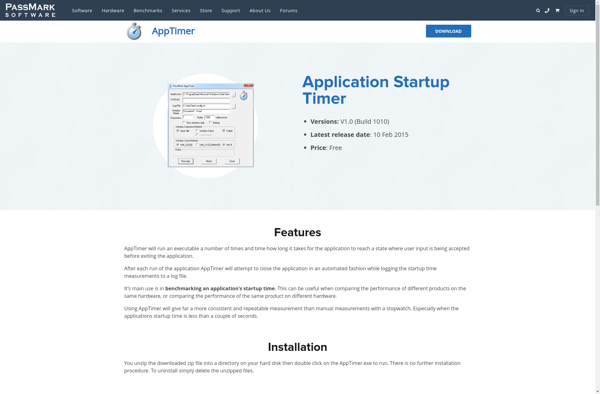
AppTimer
AppTimer is a comprehensive time tracking and productivity software designed to help professionals, freelancers, consultants, and small teams track their time accurately, monitor productivity, and bill clients easily. It provides the following key features:Intuitive manual time tracking with running timers to capture real-time work information and ensure accurate time logsIdle...
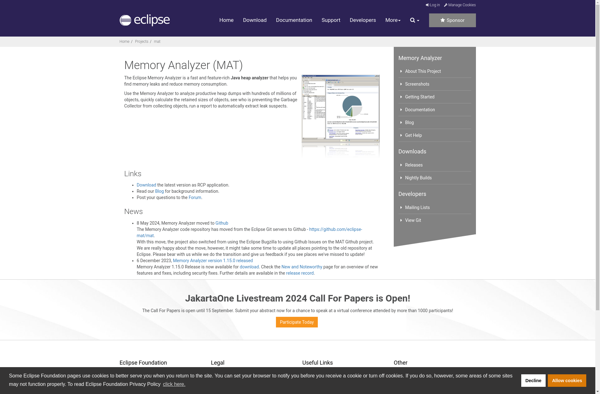
Eclipse Memory Analyzer
Eclipse Memory Analyzer (MAT) is an open-source tool designed for analyzing Java heap memory usage, finding memory leaks, and minimizing memory consumption. It is commonly used for optimizing and troubleshooting memory problems in Java applications.MAT provides several key features for memory analysis including:Heap dumping - MAT can analyze heap dump...