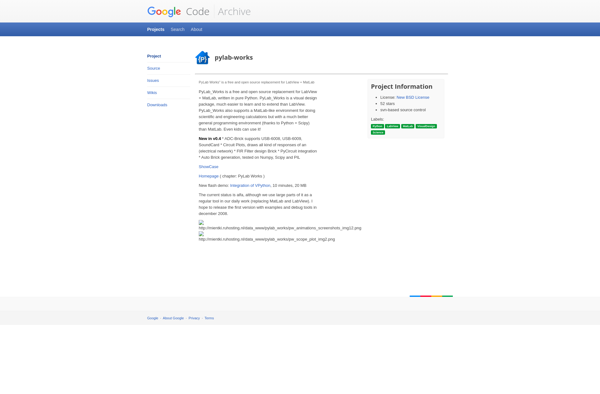
PyLab_Works
PyLab_Works is an open-source data analysis and visualization tool for Python. It provides a programming environment for scientific computing and data analysis with an easy-to-use graphical user interface.

PyLab_Works: Open-Source Data Analysis and Visualization Tool
PyLab_Works is an open-source data analysis and visualization tool for Python. It provides a programming environment for scientific computing and data analysis with an easy-to-use graphical user interface.
What is PyLab_Works?
PyLab_Works is an open-source data analysis and visualization library for the Python programming language. It is built on top of popular Python scientific libraries like NumPy, SciPy, Matplotlib, Pandas, and Scikit-Learn.
Some key features of PyLab_Works include:
- User-friendly graphical user interface for interactive data exploration and visualization design
- Broad set of visualization types including histograms, scatter plots, line plots, heat maps, bar charts, box plots, etc.
- Statistical analysis tools for descriptive statistics, hypothesis testing, correlation analysis, regression modeling, clustering, classification, and more
- Support for working with multidimensional array data, time series data, and tabular data structures like data frames and series
- Extensive customization options for figures, axes, legends, color schemes, themes, output saving, etc.
- Code export for reproducing visualizations and analysis in Python scripts
- Can be used as a Python library for integration into other applications
- Cross-platform compatibility
Overall, PyLab_Works makes an excellent tool for interactive exploratory data analysis and visualization design by Python programmers, data analysts, data scientists, and researchers.
PyLab_Works Features
Features
- Interactive Python shell for data exploration and analysis
- Math functions for numerical computations
- 2D and 3D plotting for data visualization
- Image processing and analysis capabilities
- Statistical analysis tools
- GUI for creating workflows and customizable plots
- Extendable with Python libraries and modules
Pricing
- Open Source
Pros
Open source and free to use
Large collection of built-in math and analysis functions
Flexible and customizable workflows
Powerful data visualization capabilities
Support for extensions and customization with Python code
Cross-platform compatibility
Cons
Steep learning curve for new users
Less user-friendly than dedicated statistical programs
Advanced features have complex documentation
Plotting can be slow for very large datasets
GUI is not as polished as commercial alternatives
Official Links
Reviews & Ratings
Login to ReviewThe Best PyLab_Works Alternatives
Top Data Science and Data Analysis and other similar apps like PyLab_Works
LabVIEW
LabVIEW (Laboratory Virtual Instrument Engineering Workbench) is a system design platform and development environment for visual programming language from National Instruments. It is commonly used by scientists and engineers to develop sophisticated measurement, test, and control systems.LabVIEW differs from traditional programming languages in that it uses a graphical interface to...

Lawson Labs
Lawson Labs is a flexible no-code application development platform designed specifically for businesses. It provides a quick and easy way for non-technical users to build custom internal apps, automations, and workflows to meet specific business needs, without any coding required.With an intuitive drag-and-drop interface and vast library of pre-built functions,...

FlowStone
FlowStone is a visual programming language and integrated development environment focused on interactivity, simulations, and games. It utilizes a graphical, node-based workflow that enables users to connect logic blocks in a drag-and-drop interface to create complex behaviors and interactions without writing code.Some key features and capabilities of FlowStone include:Interactive application...
