Randomlyst

Randomlyst: Data Analysis & Visualization Software
Explore, analyze and visualize data sets with Randomlyst, a user-friendly software featuring an intuitive drag-and-drop interface for creating charts, maps and dashboards.
What is Randomlyst?
Randomlyst is a powerful yet easy-to-use data analysis and visualization software designed to help people make sense of data. With Randomlyst, you can connect to a wide variety of data sources, clean and transform data, and create insightful interactive visualizations with just a few clicks.
Some key features of Randomlyst include:
- Intuitive drag-and-drop interface for building charts, maps, dashboards and other visuals
- Broad data connectivity to files, databases, data warehouses, cloud apps and more
- Smart assisted data preparation tools for shaping, cleansing and transforming data
- Hundreds of customizable visualization types including scatter plots, bar charts, heat maps and more
- Ad hoc analysis and exploration as well as dashboarding capabilities
- Collaboration tools for sharing insights and analyzing data together
- Scheduling and alerts for regular reporting and updates
- APIs and embed options for integrating visuals into other apps
- On-premise or cloud deployment options available
With its self-service model and code-free environment, Randomlyst makes data analysis accessible to everyone across an organization. Whether you need to perform simple ad-hoc queries or build complex data models and visualizations, Randomlyst provides the tools to extract meaningful insights from your data.
Randomlyst Features
Features
- Drag-and-drop interface for building visualizations
- Supports various chart types like bar, line, pie, scatter plots etc
- Interactive dashboards to view multiple visuals together
- Geospatial analysis with maps
- Statistical analysis tools
- Collaboration features to share insights
Pricing
- Freemium
- Subscription-Based
Pros
Cons
Reviews & Ratings
Login to ReviewThe Best Randomlyst Alternatives
Top Data Analysis and Visualization and other similar apps like Randomlyst
Here are some alternatives to Randomlyst:
Suggest an alternative ❐RANDOM.ORG
Faker
Random Surrealism Generator
GeneratorMix

Random Phrase Generator

Rolz
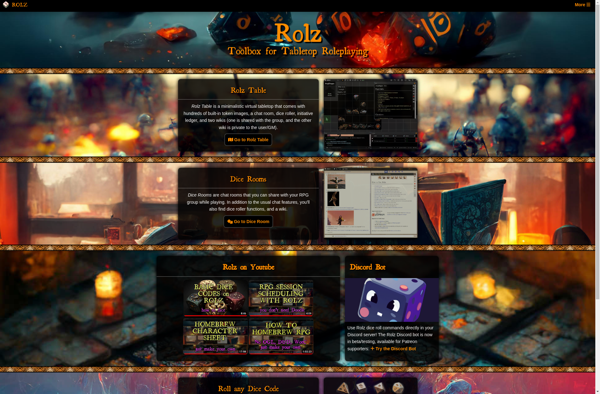
Dice Roller: Alt Dice

Random-Required
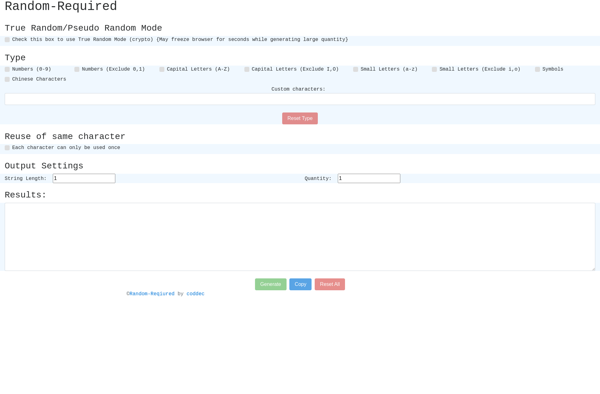
The Surrealist
Random Number Generator
Randommer
RandomProfile
8-Bit Dice Roller
