Saiku

Saiku: Open Source Data Visualization & Analytics Software
Saiku is an open source data visualization and analytics software focused on business intelligence. It allows users to connect to data sources like SQL databases, OLAP cubes, and CSV files, then create interactive reports, charts, dashboards and more for data analysis.
What is Saiku?
Saiku is an open source business intelligence software used for interactive data visualization and analytics. It enables users to easily explore, analyze and visualize data from a variety of sources including SQL databases, OLAP cubes, flat files such as spreadsheet files or CSVs.
Some key features of Saiku include:
- Intuitive drag-and-drop interface for report building and data exploration
- Support for a wide range of data sources like MySQL, Oracle, MS SQL Server, MongoDB, Microsoft Analysis Services, Mondrian and XML/A
- Powerful OLAP functionality for slicing data across multiple dimensions
- Interactive charts and tables with drill-down, filtering and other capabilities
- Ad-hoc reporting for on-the-fly data analysis without rigid structures
- Scheduled and cached reports to save and automate delivery
- Export reports and visualizations to PDF, Excel, CSV formats
Saiku provides self-service business intelligence, allowing non-technical business users to easily access, analyze and share data insights. With its rich visualization capabilities and flexibility to work with diverse data sources, Saiku is well-suited for organizations looking to democratize data analytics and enable fact-based decision making.
Saiku Features
Features
- Ad-hoc reporting
- Interactive data exploration
- Drag-and-drop report designer
- Charting and visualization
- Works with SQL, MDX, OLAP data sources
Pricing
- Open Source
Pros
Cons
Official Links
Reviews & Ratings
Login to ReviewThe Best Saiku Alternatives
Top Business & Commerce and Business Intelligence and other similar apps like Saiku
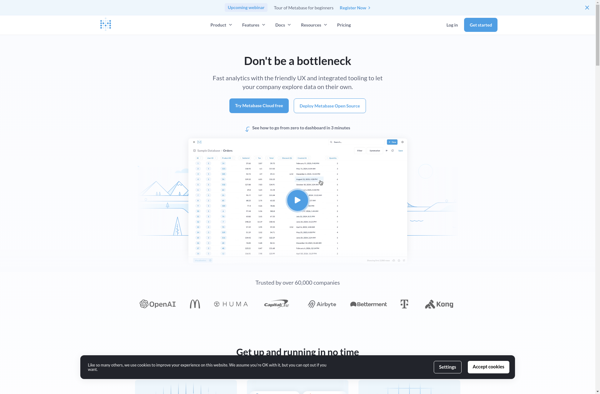
Metabase

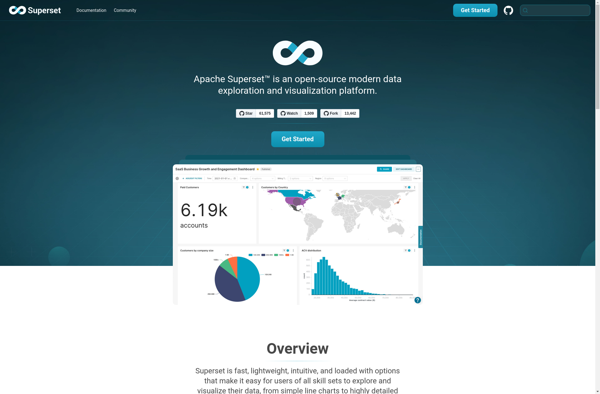
Apache Superset

Flexmonster
