StatsCrop is a user-friendly statistical analysis software designed for agricultural researchers. It provides intuitive tools to easily explore, visualize, and analyze agricultural field trial data to understand treatment effects across environments.
StatsCrop: User-Friendly Statistical Analysis Software for Agricultural Researchers
Explore, visualize, and analyze agricultural field trial data with StatsCrop's intuitive tools to understand treatment effects across environments.
What is StatsCrop?
StatsCrop is an easy to use statistical analysis software application designed specifically for agricultural researchers analyzing multi-environment field trial data. It provides researchers with an intuitive graphical user interface to easily explore, visualize, and analyze their field trial data to understand treatment effects across environments and years.
With StatsCrop, researchers can quickly import and wrangle their agricultural field trial data, handle unbalanced designs and missing data, run a wide range of ANOVA and meta-analysis to test for treatment effects and interactions. The interactive graphs and charts allow for deeper understanding and insights from the analysis. Built-in post-hoc tests automatically determine which treatments have significant effects.
Other key features include powerful options for exploring genotype-by-environment interactions, comparing treatment means, generating box plots and histograms by environment and treatment. Researchers can also leverage multiple comparison tests like Tukey's and Dunnett's to compare treatment means. The comprehensive reporting features allow summarizing the key findings.
Overall, StatsCrop saves agricultural researchers tremendous time and effort in analyzing complex multi-environment trial data compared to general statistical programs. With an easy to use interface tailored for agricultural data, intuitive visualization, automated analysis, and reporting, StatsCrop is designed to help extract actionable insights fast from agricultural field trials.
StatsCrop Features
Features
User-friendly interface
Intuitive tools for data exploration and visualization
Specialized for analyzing agricultural field trial data
Statistical analysis capabilities like ANOVA, correlations, regressions
Interactive and customizable graphs and charts
Geospatial analysis
Data management tools
Can handle unbalanced data
Output customizable, publication-ready tables and graphs
Pricing
One-time Purchase
Pros
Specialized for agricultural research
Intuitive and easy to use
Powerful statistical analysis capabilities
Interactive data visualization
Customizable graphs and tables
Can handle complex unbalanced data
Data management capabilities in one software
Cost-effective compared to general statistical software
Cons
Limited to agricultural data analysis, not general purpose statistical software
Less statistical methods than dedicated stats packages like SAS, R
May require training/learning curve for non-stats users
Only available for Windows, no Mac or Linux version
Statvoo is a free web-based statistical analysis software designed for students, researchers, marketers, and other professionals who need access to basic and advanced statistical tools for data analysis. It provides an easy-to-use interface and features a comprehensive set of analytical capabilities including descriptive statistics, hypothesis testing, correlation analysis, regression modeling,...
SimilarWeb is a popular website analytics platform used by over 200,000 companies to understand website traffic and digital marketing performance. It provides detailed analytics on traffic sources, geography, visitor demographics, engagement metrics, referring sites, organic and paid search data, and more for any website.Some key features of SimilarWeb include:Traffic analytics...
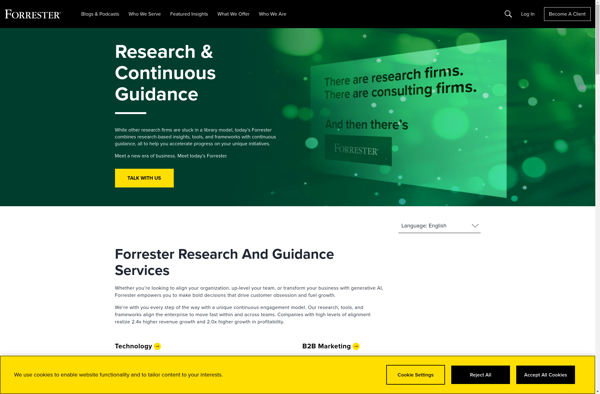
Forrester Research is an independent research company that provides advice on existing and potential impact of technology for its clients and the public. Founded in 1983 and headquartered in Cambridge, Massachusetts, Forrester serves a global clientele comprised of large enterprises, technology vendors and suppliers, and the technology and telecommunications industries.Forrester's...
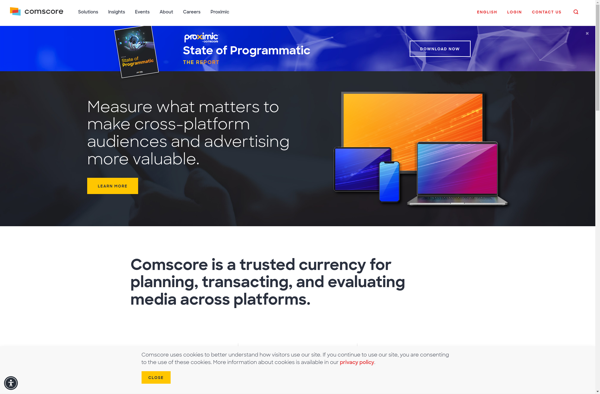
ComScore Media Metrix is a syndicated media measurement service that provides in-depth audience behavior data for digital platforms and content. The service focuses on providing actionable insights to publishers, advertisers, agencies and other customers to help them understand their audience, benchmark performance, identify growth opportunities and make strategic decisions.Some key...
Worth Of Web Academy is an online learning platform designed to help individuals and businesses succeed online. It offers a wide range of courses and training programs focused on areas like digital marketing, search engine optimization (SEO), web analytics, content creation, and social media marketing.The courses at Worth Of Web...
Visit Rank is a user-friendly website analytics platform designed to provide detailed insights into visitor behavior and traffic patterns. Some key features of Visit Rank include:Real-time statistics on visits, unique visitors, page views, bounce rates, and moreIn-depth analysis of visitor behavior flows - see which pages visitors view, entry/exit pages,...
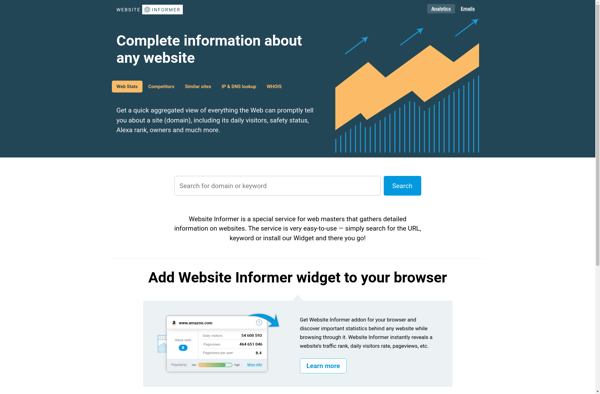
Website Informer is a useful free tool for getting in-depth analytics and data about any website. Simply enter a URL and Website Informer will provide a detailed report on various aspects of that site.Some of the key information provided includes:Performance - Page load times, page size, requests made, and performance...
HypeStat is a user-friendly website traffic analytics platform designed to help bloggers, marketers, and webmasters better understand their website audience and performance. As a freemium service, HypeStat provides detailed statistics and analytics reporting at no cost for basic users.With HypeStat, users can track key website metrics like visit traffic, page...
Quantcast is an analytics platform that provides website and mobile app owners with access to audience data and real-time statistics about their traffic and visitors. Its services are designed to give digital publishers and advertisers the ability to better understand, reach, and engage with their target audience.Some key features of...
Anstrex is an open-source, freeware spreadsheet application and alternative to Microsoft Excel. Though not as fully featured, Anstrex provides core spreadsheet functionality on par with Excel, making it an attractive free option for basic to moderately advanced spreadsheet needs.At its foundation, Anstrex works like any spreadsheet application - providing tools...
Site Rank Data is a comprehensive SEO analytics platform designed to help website owners, SEO professionals, and digital marketing agencies track, monitor, and improve the search engine visibility of their websites.Key features include:Keyword ranking tracking - Site Rank Data provides accurate and up-to-date rankings data for target keywords across Google,...
Likestat is a comprehensive social media analytics platform designed to help individuals and businesses track key metrics and engagement across leading social platforms like Facebook, Twitter, Instagram, and YouTube. With Likestat, users can:Connect multiple social media profiles and pages to monitor performance.Track vanity metrics like followers, likes, comments, shares, etc....
Seoxan is a comprehensive search engine optimization automation software designed to help companies improve their website visibility in search engine results pages. It provides an all-in-one SEO analysis, recommendations and optimization platform to boost website organic traffic and conversion rates.Some key features offered by Seoxan include:SEO audit - Seoxan crawls...
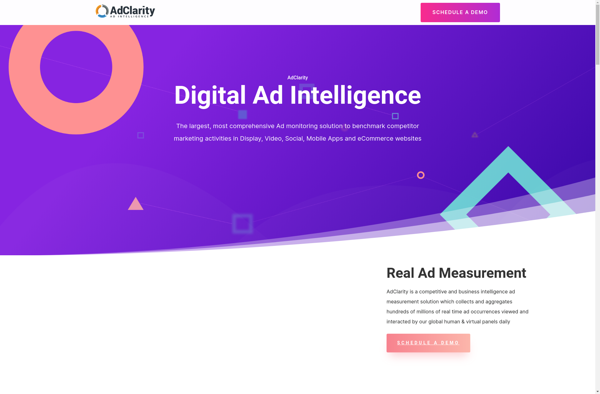
AdClarity is a robust ad analytics platform designed to provide in-depth reporting and actionable insights for digital advertising campaigns across channels. It integrates with major ad servers, DSPs, SSPs, publishers, and networks to track campaign performance and attribution.Key features of AdClarity include:Detailed metrics across display, video, mobile, social, and native...
VALBOT.COM is a comprehensive cyber security platform designed to help individuals and organizations identify and remediate vulnerabilities across their digital assets. The service provides various free scans that detect weaknesses in websites, networks, cloud infrastructure, mobile applications, and more.For websites, VALBOT.COM offers SQL injection detection, cross-site scripting scans, SSL test...