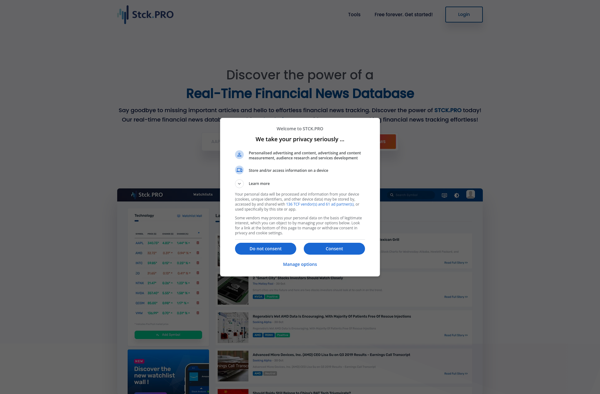
STCK.PRO is a stock charting and technical analysis platform designed for day traders. It allows users to analyze and visualize market data to identify trading opportunities. Some key features include interactive charts, drawing tools, technical indicators, and research resources
STCK.PRO: Advanced Stock Charting & Technical Analysis for Day Traders
STCK.PRO is a stock charting and technical analysis platform designed for day traders. It allows users to analyze and visualize market data to identify trading opportunities. Some key features include interactive charts, drawing tools, technical indicators, and research resources.
What is STCK.PRO?
STCK.PRO is an advanced online stock charting, analysis and visualization platform designed specifically for day traders. It provides professional-grade tools to analyze the markets, identify trading opportunities and execute trades effectively.
Some of the key features of STCK.PRO include:
Interactive stock charts with a full range of flexible customization options. Traders can add multiple charts, choose from various chart types (candlestick, line, bar etc.), apply indicators, draw trendlines and more.
An extensive range of technical indicators including moving averages, Bollinger bands, RSI, MACD and more. These can be fully customized and overlaid on the charts.
Drawing tools for basic shapes, trend lines, Fibonacci retracements, Gann fans and more to visually analyze price trends and patterns.
Multiple chart timeframes from 1 minute up to monthly. Traders can analyze both short-term and long-term trends.
Customizable pre-market and after-hours chart data for pre and post regular session analysis.
Ability to create and save customized workspaces with specific chart and indicator setups tailored to your strategy.
In-depth real time and historical research on equities including fundamentals data, filings, transcripts, headlines and more.
Stock screening based on technical and fundamental criteria to scan the market for trade ideas.
Server-side alerts to notify traders of indicator signals, price movements and events in real time.
Overall, STCK.PRO provides professional traders with a complete suite of tools and resources to analyze the markets, identify the best trading opportunities and execute precision trades all from one powerful, easy-to-use platform.
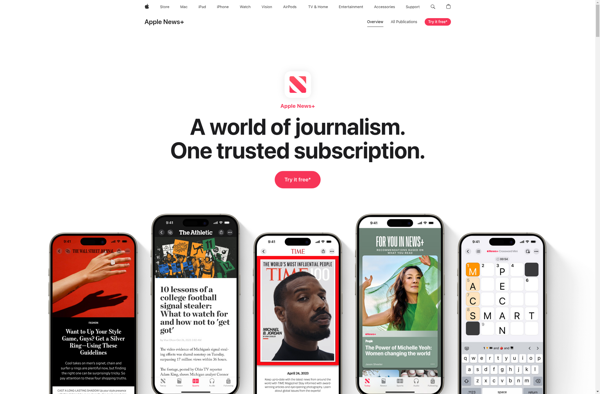
Apple News is a news aggregation app developed by Apple Inc. It comes pre-installed on iOS and macOS devices and allows users to access articles from various news publications and websites.Some key features of Apple News include:Access to articles, blogs, magazines, newspapers, and more from both large publishers and smaller...
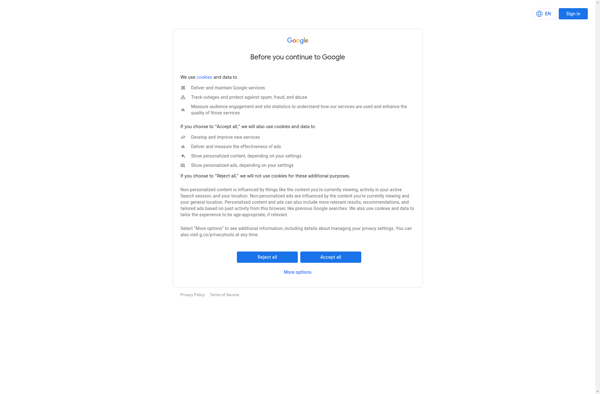
Google News is a news aggregation service developed and maintained by Google. It presents a continuous, customizable flow of articles organized from thousands of publishers and magazines.Key features of Google News include:Aggregates headlines and articles from news sources worldwideAllows users to customize news feeds based on topics, sources, locations, languages,...
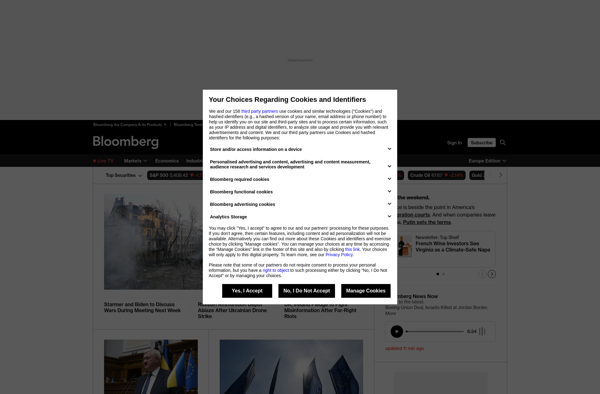
Bloomberg is a global information and technology company that focuses on business and financial data, news, analytics, and trading tools. It was founded by Michael Bloomberg in 1981 and is headquartered in New York City.The company's main product is the Bloomberg Terminal, a software system provided on leased hardware that...
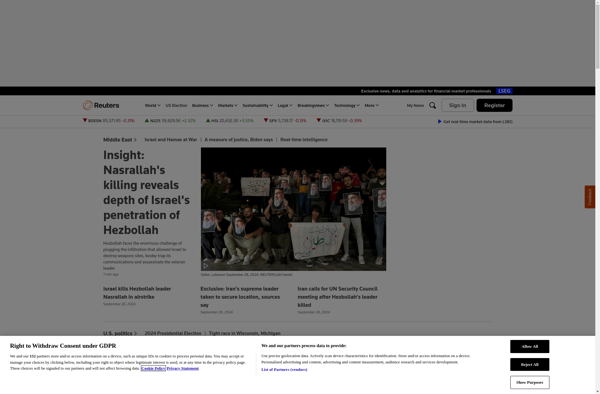
Reuters is a leading global news provider covering world affairs, business, politics, economics, science and technology, entertainment, and sports. It is part of Thomson Reuters and has over 2,500 journalists around the world gathering and delivering fast and accurate reports. Reuters was founded by Paul Julius Reuter in London in...
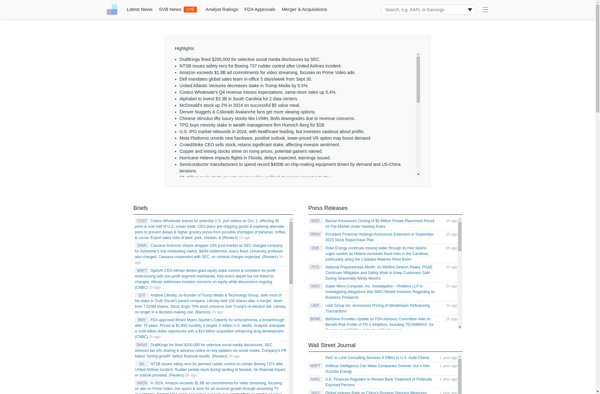
newsfilter.io is an intelligent news aggregation service that aims to solve information overload by providing readers with a personalized news feed based on their interests and reading history. It uses advanced artificial intelligence and natural language processing to analyze news articles from over 10,000 global sources and identify the most...
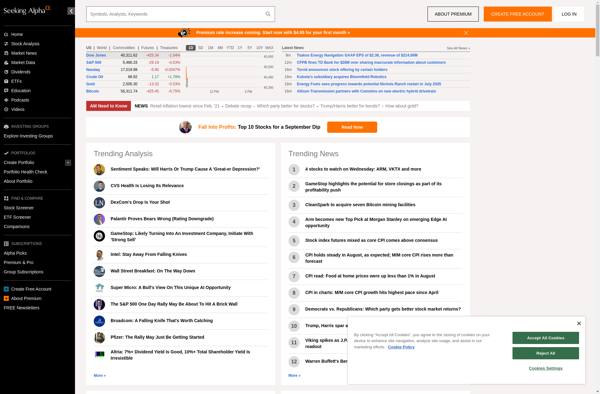
Seeking Alpha is an online crowd-sourced content platform focused on analyzing and providing news, opinion, and analysis for stocks, ETFs, mutual funds, and other financial instruments. It covers earnings reports, dividends, macroeconomic events, and trading strategies.The service is known for its wide pool of contributors, made up of investors, financiers,...
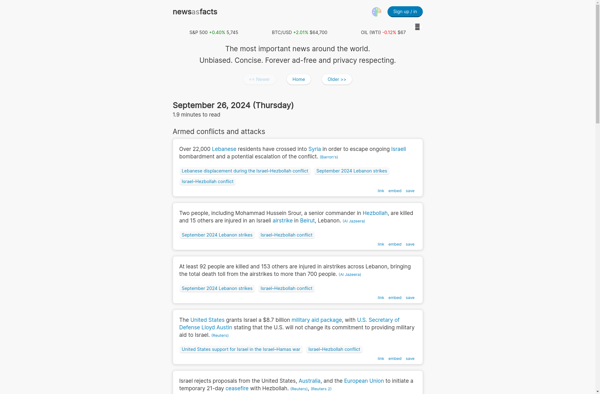
News as Facts is a news aggregation website launched in 2019 that focuses on objectively presenting news stories without putting spin, bias or sensationalism. The site's founders aimed to create a news source that gives readers just the straightforward facts on daily events.The site collects news articles from over 100...
MarketWatch is a financial information website owned by Dow Jones & Company. It provides stock market news, data, analysis and tools tailored to investors to help them research investments and make informed decisions.Some key features of MarketWatch include:Market overview - Live updates on major stock indexes, commodities, currencies and cryptocurrencies....
Tickeron is a financial data and analytics platform aimed at retail and institutional investors. It provides real-time streaming stock quotes, interactive charts with technical indicators, earnings data, analyst estimates, financial news, and proprietary sentiment analysis tools.Key features of Tickeron include:Real-time streaming quotes for stocks, ETFs, mutual funds, forex, cryptocurrencies, and...