StockCharts
StockCharts: Financial Charting and Technical Analysis Software
Interactive charts for analyzing stocks, ETFs, and mutual funds with a wide array of technical indicators for investors.
What is StockCharts?
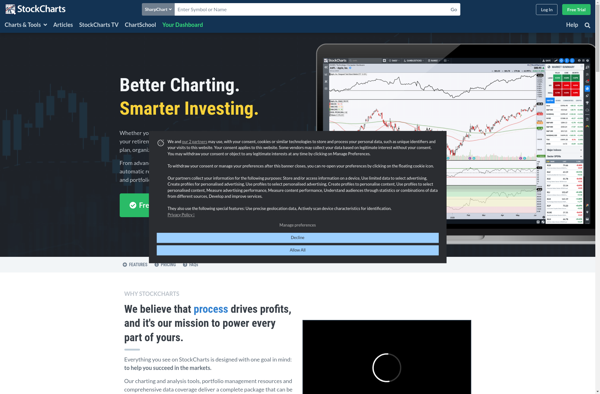
StockCharts is a financial charting and technical analysis platform designed for online stock analysis and research. It offers a variety of customizable stock charts with over 100 technical indicators to analyze securities like stocks, ETFs, mutual funds, forex and cryptocurrencies.
Key features of StockCharts include:
- Interactive JavaScript charts with zooming and annotation capabilities
- Over 100 technical indicators including moving averages, Bollinger Bands, MACD, RSI etc.
- Chart pattern recognition and automated technical analysis
- Customizable chart templates and color schemes
- Point and figure, candlestick, line break charts
- Portfolio tracking and alert capabilities
- Extensive chart galleries and discussion forums
- Client-side charting without need for Java or Flash
StockCharts offers different pricing plans for casual investors, active traders, investment websites and financial professionals. There are also free limited accounts available.
With its vast array of financial visualization tools and large online community, StockCharts provides a comprehensive stock analysis and research platform for investors looking to perform technical analysis and test trading strategies.
StockCharts Features
Features
- Interactive stock charts
- Wide array of technical indicators
- Customizable chart layouts
- Screener and scan tools
- Portfolio tracking and management
- Real-time and historical data
- Annotate and draw on charts
- Watchlists and alerts
Pricing
- Freemium
- Subscription-Based
Pros
Cons
Official Links
Reviews & Ratings
Login to ReviewThe Best StockCharts Alternatives
View all StockCharts alternatives with detailed comparison →
Top Finance and Technical Analysis and other similar apps like StockCharts
TradingView

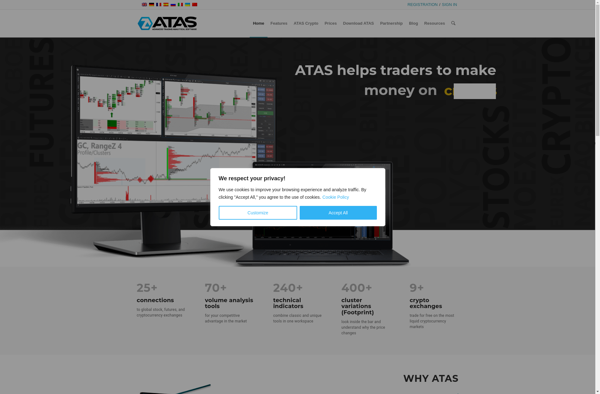
Atas
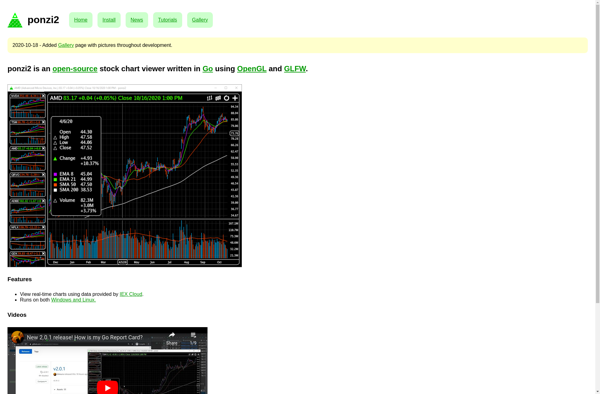
Ponzi2
AIVIA