Stocktouch
Stocktouch: Real-Time Stock Tracking & Analysis Software
Stocktouch is a stock market tracking and analysis software designed for individual investors to monitor and analyze their portfolio performance. It provides real-time stock quotes, interactive charts and analysis tools to gain insights into stock price movements.
What is Stocktouch?
Stocktouch is a user-friendly stock market software designed to help individual investors efficiently track, analyze and manage their investment portfolio. It provides real-time streaming stock quotes and interactive charts with technical indicators to analyze stock price performance.
Key features of Stocktouch include:
- Real-time stock quotes for US exchanges
- Interactive price charts with technical indicators like moving averages, Bollinger bands etc.
- Ability to create multiple watchlists to track securities
- Customizable workspace to add modules like market movers, sector performance etc.
- Fundamental data and financial ratios for equities
- Portfolio manager to track realized and unrealized gains/losses
- Economic news and events calendar integration
- Customizable alerts based on price, volume, earnings etc.
- Advanced charting with ability to draw lines, trends etc.
Stocktouch aims to provide a one-stop solution for investors to monitor overall market conditions, perform technical analysis and fundamental research and track portfolio performance. Its intuitive interface and flexibility makes it easy for new as well as experienced investors to make informed investment decisions.
Stocktouch Features
Features
- Real-time stock quotes
- Interactive charts
- Portfolio tracking
- Alerts and notifications
- Fundamental/technical analysis
- Customizable watchlists
- News feeds
- Integrations with brokers
Pricing
- Subscription-Based
- Freemium
Pros
Cons
Official Links
Reviews & Ratings
Login to ReviewThe Best Stocktouch Alternatives
View all Stocktouch alternatives with detailed comparison →
Top Business & Commerce and Investing & Trading and other similar apps like Stocktouch
Here are some alternatives to Stocktouch:
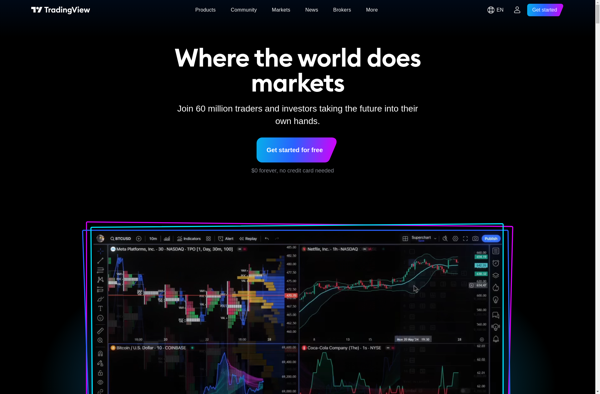
Suggest an alternative ❐TradingView
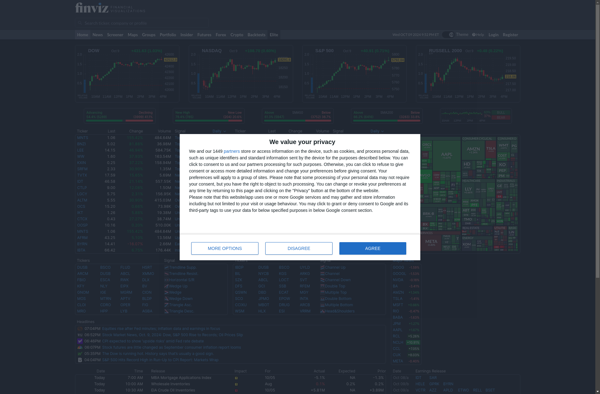
FinViz
Bloomberg
Business Quant