Telerik JustTrace is a .NET logging and tracing tool for troubleshooting bugs and optimizing application performance. It captures detailed info on exceptions, method calls, web requests, etc. to pinpoint issues.
Telerik JustTrace is a .NET logging and tracing tool for troubleshooting bugs and optimizing application performance. It captures detailed info on exceptions, method calls, web requests, etc. to pinpoint issues.
What is Telerik JustTrace?
Telerik JustTrace is a comprehensive logging and tracing solution designed specifically for .NET applications. It enables developers to capture detailed diagnostic information on application execution, including method calls, exceptions, web requests, logged messages, and custom tracing events.
JustTrace installs seamlessly into the .NET application process to track activity in production or locally during development. Its advanced filtering and small performance overhead allow it to gather targeted trace data without slowing down the application.
Key capabilities include:
Tracing exceptions and method calls to troubleshoot bugs
Tracing web requests to optimize performance
Filtering trace data to focus on relevant info
Custom trace events tolog business-specific data
Remote and historical trace analysis outside the live application
Visualize trace timelines to identify bottlenecks
Alerting on errors or performance in real-time
With its tight .NET integration and advanced diagnostics features, JustTrace enables faster issue detection and resolution. It is an invaluable tool for .NET developers and IT teams to optimize application quality and deliver better performing software.
dotTrace Memory is a .NET memory profiler developed by JetBrains for analyzing memory usage in .NET applications. It enables .NET developers to detect various memory problems like memory leaks, understand how their code uses memory, and optimize their app's memory consumption.Key features of dotTrace Memory include:Detailed memory snapshots to understand...
ANTS Performance Profiler is a comprehensive .NET profiling tool designed to help .NET developers diagnose performance issues and optimize their .NET applications. It allows profiling CPU usage, memory allocation, and database queries to identify code bottlenecks and memory leaks.Key features include:CPU profiling to find hot functions and code paths that...
AQtime Pro is a comprehensive performance profiling suite for identifying optimization opportunities in software applications. It supports profiling for .NET, C/C++, Java, and Delphi applications running on Windows, Linux, and macOS platforms.With AQtime Pro, developers can quickly analyze CPU and memory usage to understand where the application is spending time...
ANTS Memory Profiler is a performance profiling tool used to optimize .NET applications by detecting memory leaks and identifying areas for code improvement. It provides detailed analysis of managed heap memory usage down to the line of code, helping .NET developers efficiently manage memory usage and application performance.Key features of...
GlowCode is a feature-rich code editor and project management platform designed specifically for software developers. It includes capabilities like:Intelligent code completion based on machine learning to speed up codingPowerful debugger to identify and fix bugs fasterBuilt-in support for version control systems like Git and SVNTeam collaboration tools including code reviews...
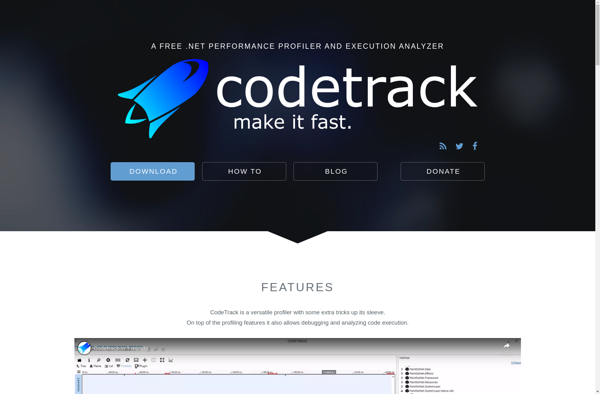
CodeTrack is an issue and project tracking software designed specifically for software development teams. It provides a centralized platform to log bugs, tasks, feature requests, and other items that need to be tracked over the course of a project.With CodeTrack, development teams can create customizable workflows to match their process....
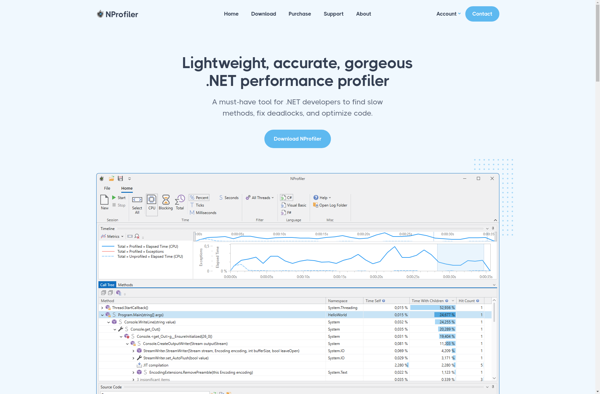
NProfiler is a performance profiling tool designed specifically for .NET applications running on Windows. It provides detailed insights into an application's memory usage, CPU utilization, execution times, and other key performance metrics.With NProfiler, developers can quickly identify memory leaks, garbage collection issues, excessive CPU usage, slow database calls, and other...
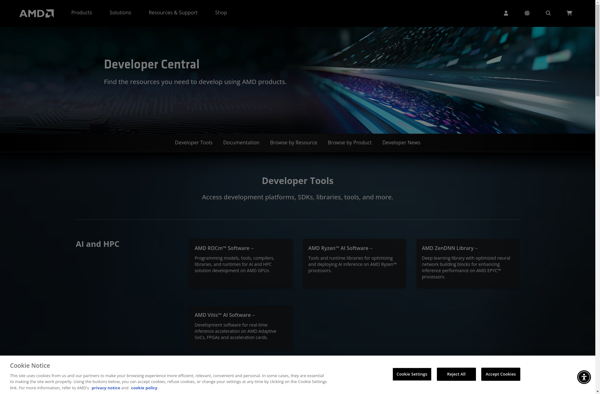
AMD CodeXL is a comprehensive tool suite that enables developers to harness the benefits of AMD heterogeneous computing platforms. It provides insights into system performance and optimizations when software is targeting AMD CPUs, GPUs and APUs.The suite includes components such as debuggers, profilers, compilers, and analyzers that work in tandem...
SlimTune is a system optimization and tuning utility for Windows designed to help speed up, fix issues with, and improve the overall performance of your computer. It includes a variety of tools and features aimed at streamlining your PC:- Registry Cleaner: Cleans up invalid registry entries and fixes issues to...