dotTrace Memory is a .NET memory profiler by JetBrains. It helps .NET developers analyze memory usage in .NET applications to find memory leaks and optimize memory usage. Key features include identifying memory issues, analyzing memory traffic, and comparing snapshots.
.NET memory profiler by JetBrains, helps analyze memory usage in .NET applications to find memory leaks and optimize memory usage, identifying memory issues, analyzing memory traffic, and comparing snapshots.
What is DotTrace Memory?
dotTrace Memory is a .NET memory profiler developed by JetBrains for analyzing memory usage in .NET applications. It enables .NET developers to detect various memory problems like memory leaks, understand how their code uses memory, and optimize their app's memory consumption.
Key features of dotTrace Memory include:
Detailed memory snapshots to understand which types and instances take up the most memory.
Ability to compare memory snapshots to identify memory issues over time.
Analyzes memory traffic to see how memory allocations change during program execution.
Detects various memory problems like memory leaks, unintentionally retained large objects, and inefficient memory usage patterns.
Supports profiling applications written in .NET Framework, .NET Core, Mono and Unity.
Integrates with major .NET IDEs like Visual Studio, Rider and Visual Studio for Mac.
Offers profiling of both 32-bit and 64-bit .NET processes.
Provides convenient visualization of profiling results.
With its advanced memory analysis capabilities, dotTrace Memory is an essential tool for .NET developers looking to fix memory issues, reduce memory footprint and optimize performance of their .NET applications.
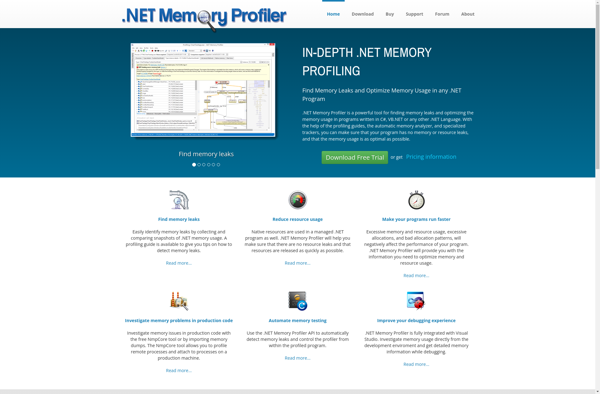
.NET Memory Profiler is a comprehensive memory and performance profiling tool for .NET applications. It allows developers to monitor memory usage, CPU usage, and other key performance metrics in real-time to identify memory leaks, wasted memory, and other issues.Key features include:Identify memory leaks caused by undisposed objectsPinpoint wasted memory from...
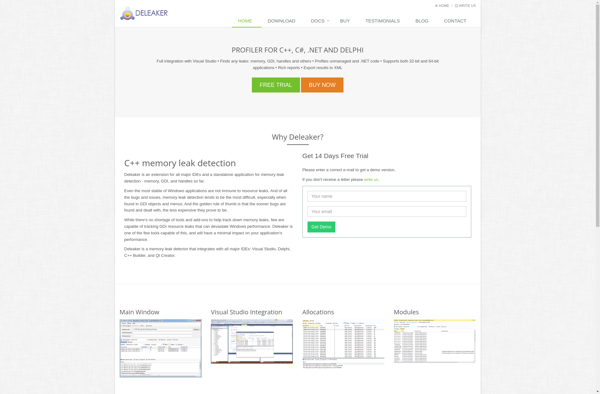
Deleaker is a powerful memory leak detection and profiling tool designed for C, C++, and C# developers. It allows detecting various memory-related issues and analyzes application memory usage to help identify memory leaks, lost memory blocks, and other problems.One of the main advantages of Deleaker is its ease of integration...
AQtime Pro is a comprehensive performance profiling suite for identifying optimization opportunities in software applications. It supports profiling for .NET, C/C++, Java, and Delphi applications running on Windows, Linux, and macOS platforms.With AQtime Pro, developers can quickly analyze CPU and memory usage to understand where the application is spending time...
CLR Profiler is a comprehensive performance profiling tool designed specifically for .NET Framework applications. It allows developers to analyze CPU and memory usage, execution times, garbage collection, and other key performance metrics.Some of the key features of CLR Profiler include:CPU sampling to identify hot code pathsInstrumentation profiling for precise method...
Stackify Prefix is a performance monitoring and profiling tool designed for developers and IT operations teams. It provides deep visibility into applications to help identify performance bottlenecks, troubleshoot issues faster, and optimize code.Key features of Stackify Prefix include:Real-user monitoring to capture metrics like response time, throughput, and errorsCode-level profiling to...
ANTS Memory Profiler is a performance profiling tool used to optimize .NET applications by detecting memory leaks and identifying areas for code improvement. It provides detailed analysis of managed heap memory usage down to the line of code, helping .NET developers efficiently manage memory usage and application performance.Key features of...
Telerik JustTrace is a comprehensive logging and tracing solution designed specifically for .NET applications. It enables developers to capture detailed diagnostic information on application execution, including method calls, exceptions, web requests, logged messages, and custom tracing events.JustTrace installs seamlessly into the .NET application process to track activity in production or...
YourKit .NET Profiler is a comprehensive performance and memory profiling tool designed specifically for .NET applications. It allows developers to analyze application execution, understand code bottlenecks, optimize performance, reduce memory usage, and improve scalability.Key features of YourKit .NET Profiler include:CPU and memory profiling to identify hotspots and memory leaksAnalysis of...