ANTS Memory Profiler
ANTS Memory Profiler is a memory and performance profiling tool for .NET applications. It helps developers identify memory leaks and optimization opportunities in their .NET code.
ANTS Memory Profiler: Memory and Performance Profiling Tool for .NET Applications
Analyze and optimize .NET application performance with ANTS Memory Profiler, identifying memory leaks and opportunities for improvement.
What is ANTS Memory Profiler?
ANTS Memory Profiler is a performance profiling tool used to optimize .NET applications by detecting memory leaks and identifying areas for code improvement. It provides detailed analysis of managed heap memory usage down to the line of code, helping .NET developers efficiently manage memory usage and application performance.
Key features of ANTS Memory Profiler include:
- Identifying memory leaks caused by events like forgotten event handlers or closures holding reference to unused objects
- Detecting which objects are maintained in memory and why they are not being garbage collected
- Analyzing memory usage over time to pinpoint where bloat occurs
- Getting detailed statistics on memory allocations per line of code
- Comparing memory snapshots to detect what code changes affect memory allocation
- Integrating with Visual Studio, Azure DevOps, Jenkins and other development tools
- Profiling production applications remotely without code changes
Overall, ANTS Memory Profiler is an essential tool for any .NET developer looking to optimize memory usage, eliminate leaks, and improve overall application performance.
ANTS Memory Profiler Features
Features
- Memory leak detection
- Performance profiling
- Detailed memory usage analysis
- Heap snapshots
- Allocation tracking
- Managed and unmanaged memory tracking
- Supports .NET Framework, .NET Core, and .NET 5
Pricing
- Freemium
- One-time Purchase
Pros
Provides in-depth memory usage analysis
Helps identify and fix memory leaks
Supports a wide range of .NET versions
User-friendly interface
Integrates with Visual Studio
Cons
Limited free version with fewer features
Paid version can be expensive for some users
May have a learning curve for some developers
Reviews & Ratings
Login to ReviewThe Best ANTS Memory Profiler Alternatives
View all ANTS Memory Profiler alternatives with detailed comparison →
Top Development and Debugging & Profiling and other similar apps like ANTS Memory Profiler
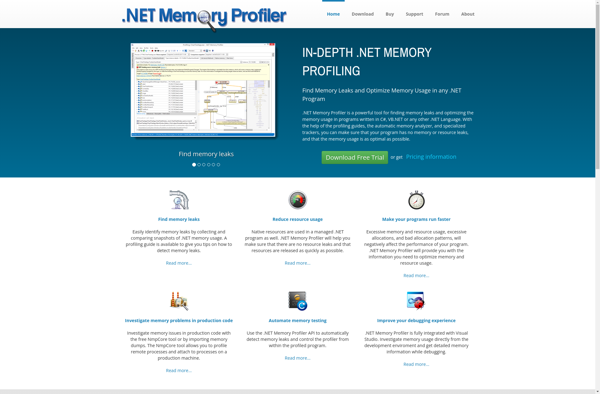
.NET Memory Profiler
.NET Memory Profiler is a comprehensive memory and performance profiling tool for .NET applications. It allows developers to monitor memory usage, CPU usage, and other key performance metrics in real-time to identify memory leaks, wasted memory, and other issues.Key features include:Identify memory leaks caused by undisposed objectsPinpoint wasted memory from...
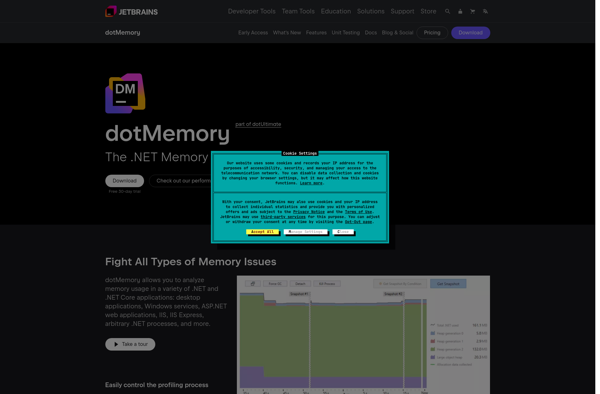
DotMemory
dotMemory is a powerful .NET memory profiler developed by JetBrains, the makers of popular IDEs like ReSharper and Rider. It aims to help .NET developers analyze memory usage in their .NET applications, identify memory issues early and optimize overall memory usage.Some key features of dotMemory include:Detailed snapshot analysis - Get...
DotTrace Memory
dotTrace Memory is a .NET memory profiler developed by JetBrains for analyzing memory usage in .NET applications. It enables .NET developers to detect various memory problems like memory leaks, understand how their code uses memory, and optimize their app's memory consumption.Key features of dotTrace Memory include:Detailed memory snapshots to understand...
CLR Profiler for .NET Framework
CLR Profiler is a comprehensive performance profiling tool designed specifically for .NET Framework applications. It allows developers to analyze CPU and memory usage, execution times, garbage collection, and other key performance metrics.Some of the key features of CLR Profiler include:CPU sampling to identify hot code pathsInstrumentation profiling for precise method...
Stackify Prefix
Stackify Prefix is a performance monitoring and profiling tool designed for developers and IT operations teams. It provides deep visibility into applications to help identify performance bottlenecks, troubleshoot issues faster, and optimize code.Key features of Stackify Prefix include:Real-user monitoring to capture metrics like response time, throughput, and errorsCode-level profiling to...
Telerik JustTrace
Telerik JustTrace is a comprehensive logging and tracing solution designed specifically for .NET applications. It enables developers to capture detailed diagnostic information on application execution, including method calls, exceptions, web requests, logged messages, and custom tracing events.JustTrace installs seamlessly into the .NET application process to track activity in production or...
YourKit .NET Profiler
YourKit .NET Profiler is a comprehensive performance and memory profiling tool designed specifically for .NET applications. It allows developers to analyze application execution, understand code bottlenecks, optimize performance, reduce memory usage, and improve scalability.Key features of YourKit .NET Profiler include:CPU and memory profiling to identify hotspots and memory leaksAnalysis of...