CLR Profiler for .NET Framework
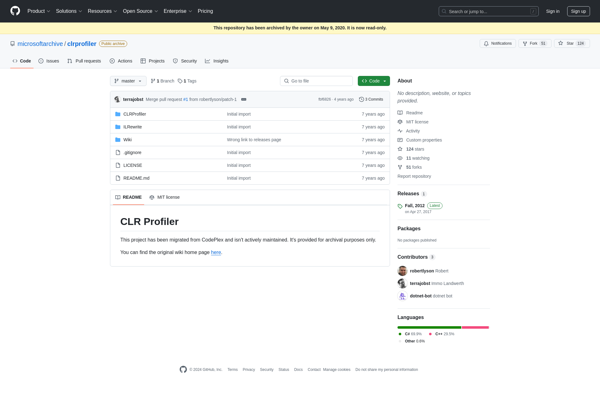
CLR Profiler: Performance Profiling Tool for .NET Framework
CLR Profiler is a performance profiling tool for .NET Framework applications. It helps developers identify performance bottlenecks and optimize managed code.
What is CLR Profiler for .NET Framework?
CLR Profiler is a comprehensive performance profiling tool designed specifically for .NET Framework applications. It allows developers to analyze CPU and memory usage, execution times, garbage collection, and other key performance metrics.
Some of the key features of CLR Profiler include:
- CPU sampling to identify hot code paths
- Instrumentation profiling for precise method timing
- Allocation profiling to understand object creation patterns
- Blocking analysis to detect thread contention
- GC profiling to optimize memory usage
- Historical comparison of profiling snapshots
- Call tree diagrams for easy visualization
- Support for ASP.NET applications
CLR Profiler integrates seamlessly with Visual Studio to provide a streamlined profiling workflow. Developers can easily start, stop, and analyze profiles without leaving the IDE. The reports are presented in a user-friendly GUI with charts, caller-callee trees, and filtered views to drill into the data.
Overall, CLR Profiler is an essential tool for .NET developers looking to optimize their applications for speed and memory usage.
CLR Profiler for .NET Framework Features
Features
- CPU and memory profiling
- Method-level profiling
- Exception call stack tracing
- ASP.NET profiling
- SQL profiling
- IL code instrumentation
Pricing
- Free
- One-time Purchase
Pros
Cons
Reviews & Ratings
Login to ReviewNo reviews yet
Be the first to share your experience with CLR Profiler for .NET Framework!
Login to ReviewThe Best CLR Profiler for .NET Framework Alternatives
View all CLR Profiler for .NET Framework alternatives with detailed comparison →
Top Development and Debugging & Profiling and other similar apps like CLR Profiler for .NET Framework
Here are some alternatives to CLR Profiler for .NET Framework:
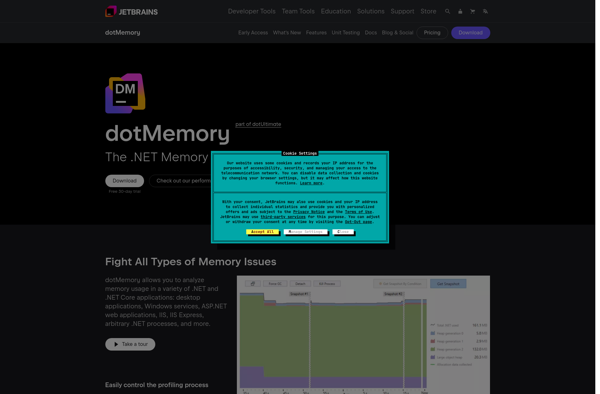
Suggest an alternative ❐DotMemory
DotTrace Memory
ANTS Memory Profiler
SlimTune