dotMemory

DotMemory

dotMemory is a .NET memory profiler developed by JetBrains. It helps .NET developers analyze memory usage in their .NET applications to find memory leaks and optimize memory usage. dotMemory provides detailed heap analysis, allocation tracking, memory traffic views and can integr
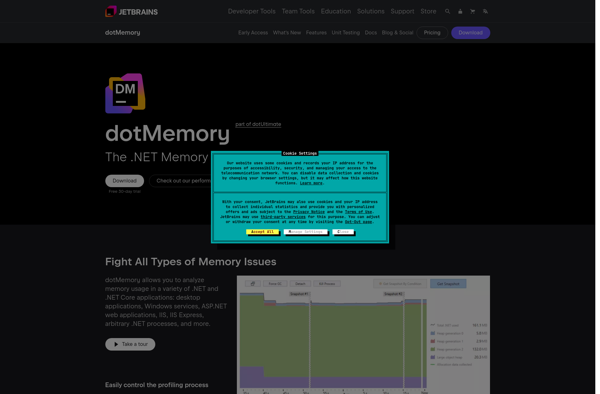
dotMemory image
memory profiler net c f vbnet

dotMemory: .NET Memory Profiler

dotMemory helps .NET developers analyze memory usage in their applications, find memory leaks, and optimize memory usage, providing detailed heap analysis, allocation tracking, and integration with Visual Studio.

What is DotMemory?

dotMemory is a powerful .NET memory profiler developed by JetBrains, the makers of popular IDEs like ReSharper and Rider. It aims to help .NET developers analyze memory usage in their .NET applications, identify memory issues early and optimize overall memory usage.

Some key features of dotMemory include:

  • Detailed snapshot analysis - Get an in-depth breakdown of your application's memory use including information on managed heap size, object instance counts, reference chains between objects etc.
  • Real-time profiling - Observe your application's memory allocations and object lifetime in real-time to identify leaks and other issues.
  • Allocation tracking - Pinpoint allocation hotspots in your code to find wasteful allocations or candidates for optimization.
  • .NET object retention graphs - Visually analyze dependencies between application objects to uncover roots of memory leaks.
  • Memory traffic views - Understand memory allocation patterns over time to proactively find anomalies.
  • Integration with Visual Studio - Review profiling snapshots and analyze memory issues without leaving Visual Studio.

With its rich feature set, dotMemory positions itself as a go-to tool for .NET developers looking to ship optimized .NET applications with smooth memory usage. The tool works for a variety of .NET application types including Windows desktop, ASP.NET web apps, Windows services and more.

DotMemory Features

Features

  1. Detailed memory snapshot analysis
  2. Allocation tracking to detect memory leaks
  3. CPU profiling to find performance bottlenecks
  4. Integrates with Visual Studio and JetBrains Rider
  5. Supports .NET, .NET Core and .NET Framework apps

Pricing

  • Free limited trial
  • Subscription-based for commercial use

Pros

Very detailed memory diagnostic capabilities

Easy to use UI and integration with IDEs

Support for a wide range of .NET application types

Can be used in production via profiler API

Cons

Not free for commercial use

Lacks some advanced profiling features found in competitors

Steep learning curve for some advanced analysis features


The Best DotMemory Alternatives

Top Development and Debugging & Profiling and other similar apps like DotMemory


.NET Memory Profiler icon
.NET Memory Profiler

.NET Memory Profiler is a comprehensive memory and performance profiling tool for .NET applications. It allows developers to monitor memory usage, CPU usage, and other key performance metrics in real-time to identify memory leaks, wasted memory, and other issues.Key features include:Identify memory leaks caused by undisposed objectsPinpoint wasted memory from...
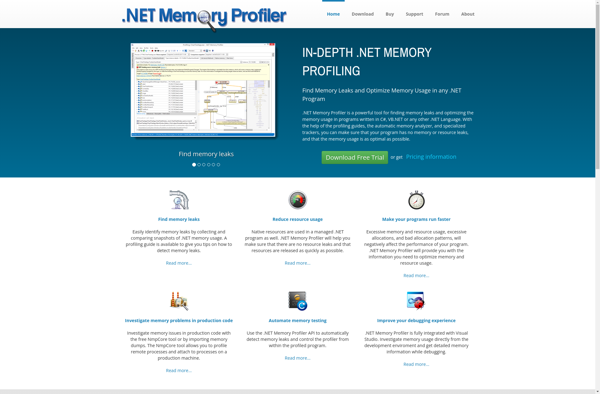
.NET Memory Profiler image
Deleaker icon

Deleaker

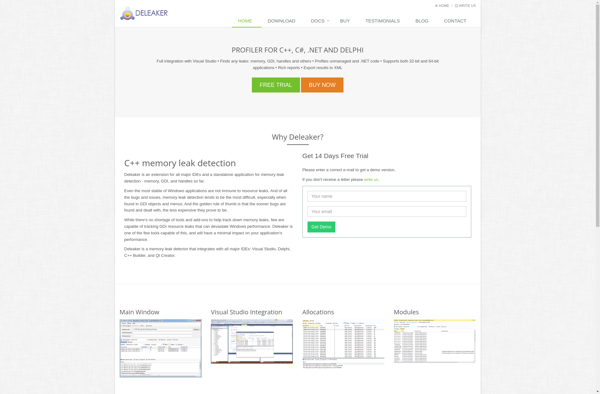
Deleaker is a powerful memory leak detection and profiling tool designed for C, C++, and C# developers. It allows detecting various memory-related issues and analyzes application memory usage to help identify memory leaks, lost memory blocks, and other problems.One of the main advantages of Deleaker is its ease of integration...
Deleaker image
CLR Profiler for .NET Framework icon

CLR Profiler for .NET Framework

CLR Profiler is a comprehensive performance profiling tool designed specifically for .NET Framework applications. It allows developers to analyze CPU and memory usage, execution times, garbage collection, and other key performance metrics.Some of the key features of CLR Profiler include:CPU sampling to identify hot code pathsInstrumentation profiling for precise method...
CLR Profiler for .NET Framework image
Stackify Prefix icon

Stackify Prefix

Stackify Prefix is a performance monitoring and profiling tool designed for developers and IT operations teams. It provides deep visibility into applications to help identify performance bottlenecks, troubleshoot issues faster, and optimize code.Key features of Stackify Prefix include:Real-user monitoring to capture metrics like response time, throughput, and errorsCode-level profiling to...
Stackify Prefix image
ANTS Memory Profiler icon

ANTS Memory Profiler

ANTS Memory Profiler is a performance profiling tool used to optimize .NET applications by detecting memory leaks and identifying areas for code improvement. It provides detailed analysis of managed heap memory usage down to the line of code, helping .NET developers efficiently manage memory usage and application performance.Key features of...
ANTS Memory Profiler image
YourKit .NET Profiler icon

YourKit .NET Profiler

YourKit .NET Profiler is a comprehensive performance and memory profiling tool designed specifically for .NET applications. It allows developers to analyze application execution, understand code bottlenecks, optimize performance, reduce memory usage, and improve scalability.Key features of YourKit .NET Profiler include:CPU and memory profiling to identify hotspots and memory leaksAnalysis of...
YourKit .NET Profiler image