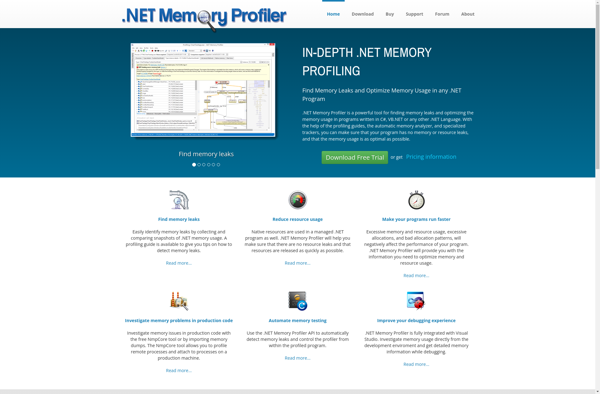
.NET Memory Profiler is a performance profiling tool for .NET applications that focuses specifically on monitoring memory usage. It helps developers identify memory leaks and optimize memory allocation.
.NET Memory Profiler: Performance Profiling Tool for .NET Applications
Monitor memory usage, identify memory leaks, and optimize memory allocation with .NET Memory Profiler, a dedicated performance profiling tool for .NET applications.
What is .NET Memory Profiler?
.NET Memory Profiler is a comprehensive memory and performance profiling tool for .NET applications. It allows developers to monitor memory usage, CPU usage, and other key performance metrics in real-time to identify memory leaks, wasted memory, and other issues.
Key features include:
Identify memory leaks caused by undisposed objects
Pinpoint wasted memory from oversized strings, arrays, dictionaries etc.
Monitor allocations via stack traces to understand what is causing them
Compare memory usage across different versions of code
Analyze CPU and GC impact on responsiveness
Standalone and Visual Studio integrated usage
Support for .NET Framework, .NET Core, ASP.NET, Azure, Xamarin and more
.NET Memory Profiler makes it easy for .NET developers to optimize their applications' speed and stability by identifying inefficient memory usage. The detailed reports and real-time monitoring provide valuable insights for reducing the application's memory footprint.
.NET Memory Profiler Features
Features
Detailed memory usage analysis
Identification of memory leaks
Optimization of memory allocation
Visualization of memory usage over time
Profiling of .NET applications
Support for .NET Framework and .NET Core
Pricing
Free
Subscription-Based
Pros
Focuses specifically on memory profiling for .NET applications
Provides in-depth analysis of memory usage and leaks
Easy to use and understand the memory usage patterns
Helps developers optimize memory allocation and performance
Cons
Limited to .NET applications, not applicable for other platforms
May require additional setup and configuration for complex applications
Can have a learning curve for developers not familiar with memory profiling
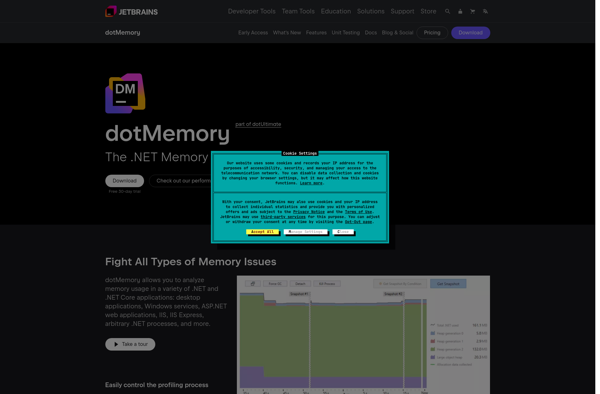
dotMemory is a powerful .NET memory profiler developed by JetBrains, the makers of popular IDEs like ReSharper and Rider. It aims to help .NET developers analyze memory usage in their .NET applications, identify memory issues early and optimize overall memory usage.Some key features of dotMemory include:Detailed snapshot analysis - Get...
dotTrace Memory is a .NET memory profiler developed by JetBrains for analyzing memory usage in .NET applications. It enables .NET developers to detect various memory problems like memory leaks, understand how their code uses memory, and optimize their app's memory consumption.Key features of dotTrace Memory include:Detailed memory snapshots to understand...
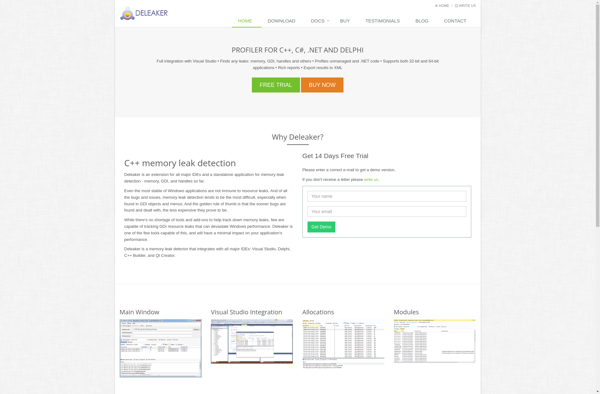
Deleaker is a powerful memory leak detection and profiling tool designed for C, C++, and C# developers. It allows detecting various memory-related issues and analyzes application memory usage to help identify memory leaks, lost memory blocks, and other problems.One of the main advantages of Deleaker is its ease of integration...
Stackify Prefix is a performance monitoring and profiling tool designed for developers and IT operations teams. It provides deep visibility into applications to help identify performance bottlenecks, troubleshoot issues faster, and optimize code.Key features of Stackify Prefix include:Real-user monitoring to capture metrics like response time, throughput, and errorsCode-level profiling to...
ANTS Memory Profiler is a performance profiling tool used to optimize .NET applications by detecting memory leaks and identifying areas for code improvement. It provides detailed analysis of managed heap memory usage down to the line of code, helping .NET developers efficiently manage memory usage and application performance.Key features of...
YourKit .NET Profiler is a comprehensive performance and memory profiling tool designed specifically for .NET applications. It allows developers to analyze application execution, understand code bottlenecks, optimize performance, reduce memory usage, and improve scalability.Key features of YourKit .NET Profiler include:CPU and memory profiling to identify hotspots and memory leaksAnalysis of...