Deleaker

Deleaker

Deleaker is a memory leak detection tool for C, C++, and C# code. It helps developers identify and fix memory leaks and allocation issues in their software during development and testing phases. Deleaker also provides detailed memory profiling reports.
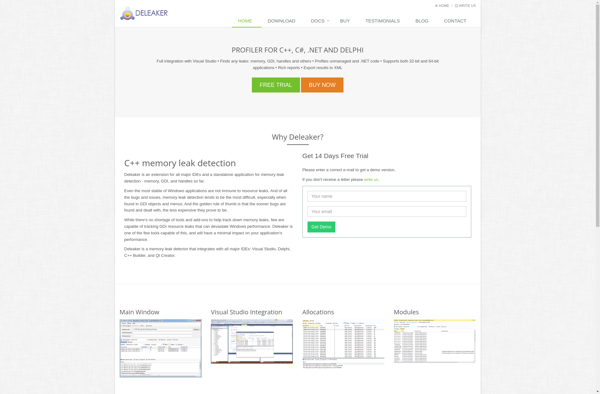
Deleaker image
memory-leak-detection c c allocation-tracking

Deleaker: Memory Leak Detection Tool for C, C++, & C#

Identify and fix memory leaks with Deleaker, a comprehensive tool for detecting allocation issues in C, C++, and C# code.

What is Deleaker?

Deleaker is a powerful memory leak detection and profiling tool designed for C, C++, and C# developers. It allows detecting various memory-related issues and analyzes application memory usage to help identify memory leaks, lost memory blocks, and other problems.

One of the main advantages of Deleaker is its ease of integration into the development process. It fully supports major IDEs like Visual Studio and can profile debug and release builds without code changes. The tool generates detailed memory reports that provide information on allocated and leaked blocks, call stacks, and other valuable data.

Key features of Deleaker include:

  • Detecting memory leaks of native code in Windows applications
  • Detailed memory profiling reports to pinpoint allocation hotspots
  • Stack traces showing where each block was allocated from
  • Support for multi-threaded applications
  • Integration with Visual Studio for profiling debug/release builds

Deleaker is useful for any C, C++, and .NET developer looking to eliminate memory issues that can lead to crashes, performance problems or instability. Its reports allow quickly identifying problematic parts of code that cause leaks or waste memory. With detailed call stack tracking, the root causes of memory allocation problems can be found and fixed promptly.

Deleaker Features

Features

  1. Detects memory leaks and allocation issues
  2. Supports C, C++ and C# code
  3. Provides detailed memory profiling reports
  4. Integrates with Visual Studio, Eclipse and other IDEs
  5. Identifies resources that are not freed properly
  6. Tracks allocations and deallocations in real time

Pricing

  • Free
  • Freemium
  • Subscription-Based

Pros

Finds various types of memory issues effectively

Easy to set up and integrate into existing workflows

Help improve code quality and performance

Reduces time spent debugging memory problems

Detailed reports provide insights into memory usage

Cons

Can slow down application performance

Not free for commercial use

Limited to only a few programming languages

Requires learning curve to use advanced features


The Best Deleaker Alternatives

Top Development and Debugging & Profiling and other similar apps like Deleaker


.NET Memory Profiler icon

.NET Memory Profiler

.NET Memory Profiler is a comprehensive memory and performance profiling tool for .NET applications. It allows developers to monitor memory usage, CPU usage, and other key performance metrics in real-time to identify memory leaks, wasted memory, and other issues.Key features include:Identify memory leaks caused by undisposed objectsPinpoint wasted memory from...
.NET Memory Profiler image
Valgrind icon

Valgrind

Valgrind is an instrumentation framework for building dynamic analysis tools used to debug and profile Linux executables. It runs programs on a virtual machine and instruments the code at execution time to detect illegal memory accesses, use of uninitialized memory, memory leaks, and threading bugs and race conditions.Some of the...
Valgrind image
DotMemory icon

DotMemory

dotMemory is a powerful .NET memory profiler developed by JetBrains, the makers of popular IDEs like ReSharper and Rider. It aims to help .NET developers analyze memory usage in their .NET applications, identify memory issues early and optimize overall memory usage.Some key features of dotMemory include:Detailed snapshot analysis - Get...
DotMemory image
DotTrace Memory icon

DotTrace Memory

dotTrace Memory is a .NET memory profiler developed by JetBrains for analyzing memory usage in .NET applications. It enables .NET developers to detect various memory problems like memory leaks, understand how their code uses memory, and optimize their app's memory consumption.Key features of dotTrace Memory include:Detailed memory snapshots to understand...
DotTrace Memory image
AQtime Pro icon

AQtime Pro

AQtime Pro is a comprehensive performance profiling suite for identifying optimization opportunities in software applications. It supports profiling for .NET, C/C++, Java, and Delphi applications running on Windows, Linux, and macOS platforms.With AQtime Pro, developers can quickly analyze CPU and memory usage to understand where the application is spending time...
AQtime Pro image
GlowCode icon

GlowCode

GlowCode is a feature-rich code editor and project management platform designed specifically for software developers. It includes capabilities like:Intelligent code completion based on machine learning to speed up codingPowerful debugger to identify and fix bugs fasterBuilt-in support for version control systems like Git and SVNTeam collaboration tools including code reviews...
GlowCode image