YourKit .NET Profiler is a performance and memory profiling tool for .NET applications. It helps developers optimize application speed, memory usage, and scalability.
YourKit .NET Profiler: Performance and Memory Profiling Tool
YourKit .NET Profiler is a performance and memory profiling tool for .NET applications. It helps developers optimize application speed, memory usage, and scalability.
What is YourKit .NET Profiler?
YourKit .NET Profiler is a comprehensive performance and memory profiling tool designed specifically for .NET applications. It allows developers to analyze application execution, understand code bottlenecks, optimize performance, reduce memory usage, and improve scalability.
Key features of YourKit .NET Profiler include:
CPU and memory profiling to identify hotspots and memory leaks
Analysis of external resources usage like databases, web services, etc.
Console, desktop, web and Windows services profiling
Profiling of multi-threaded, async and parallel applications
Powerful filtering to drill down to root causes of issues
Overview, call tree, hot spots, allocation hot spots,and other analytical views
Comparison of profiler snapshots to analyze improvements
YourKit .NET Profiler seamlessly integrates with Visual Studio and major build tools like MSBuild, gulp, Grunt and FAKE. It provides expert analyses and actionable optimization advice tailored for .NET developers. With robust profiling capabilities and intuitive workflows, YourKit simplifies .NET performance troubleshooting and helps build faster, leaner .NET applications.
YourKit .NET Profiler Features
Features
CPU profiling to identify performance bottlenecks
Memory profiling to detect memory leaks and inefficient memory usage
Exception profiling to analyze exceptions thrown by the application
Thread profiling to monitor thread activity and contention
ASP.NET profiling to optimize web applications
LINQ and SQL profiling
GC profiling to tune garbage collection
Pricing
Free trial
One-time purchase
Subscription-based
Pros
Lightweight with low overhead
Integration with Visual Studio
Can profile both 32-bit and 64-bit .NET applications
Supports a wide range of .NET frameworks and languages
Allows remote profiling over the network
Good filtering and search capabilities
Cons
Limited support for profiling Silverlight applications
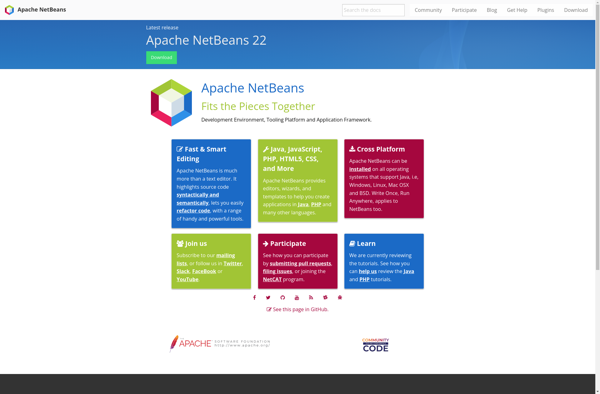
<p>Apache NetBeans is a free and open source integrated development environment focused primarily on developing Java applications. It runs on most operating systems including Windows, Linux and macOS. Key features include:</p><ul><li>Support for developing Java SE, Java ME, Java EE/Jakarta EE and JavaFX applications</li><li>Integrated development tools for HTML5, PHP, JavaScript and...
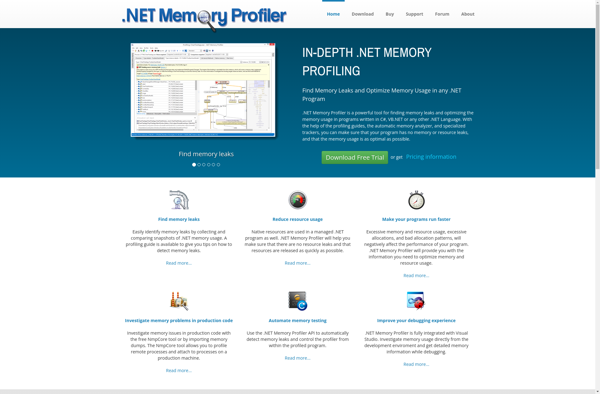
.NET Memory Profiler is a comprehensive memory and performance profiling tool for .NET applications. It allows developers to monitor memory usage, CPU usage, and other key performance metrics in real-time to identify memory leaks, wasted memory, and other issues.Key features include:Identify memory leaks caused by undisposed objectsPinpoint wasted memory from...
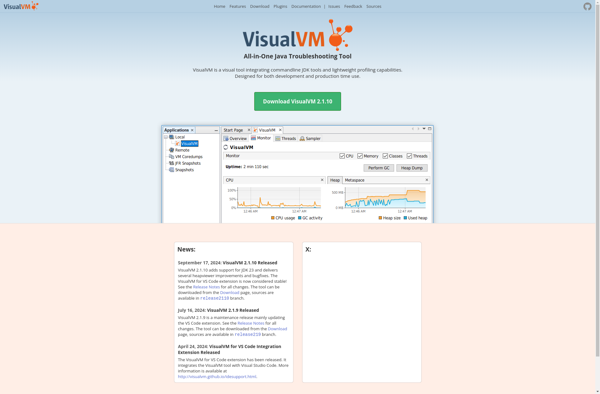
VisualVM is a versatile performance monitoring and profiling tool for Java applications. It is designed to help developers optimize, troubleshoot, and understand the runtime behavior of their Java code.Some key features of VisualVM include:Monitoring memory usage, CPU utilization, threads and other statistics for Java applicationsPerforming CPU and memory profiling to...
OpenBeans is an open-source accounting and bookkeeping software designed as an alternative to QuickBooks. It provides a suite of features targeted at small businesses to help manage their finances and accounting.Some of the key features of OpenBeans include:Easy to use graphical interface for managing general ledger, accounts payable/receivable, invoicing, billing,...
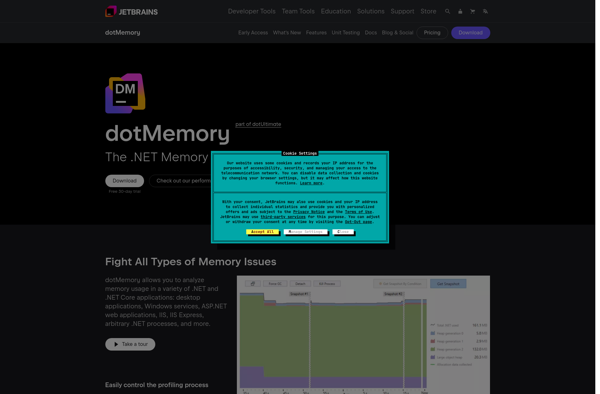
dotMemory is a powerful .NET memory profiler developed by JetBrains, the makers of popular IDEs like ReSharper and Rider. It aims to help .NET developers analyze memory usage in their .NET applications, identify memory issues early and optimize overall memory usage.Some key features of dotMemory include:Detailed snapshot analysis - Get...
dotTrace Memory is a .NET memory profiler developed by JetBrains for analyzing memory usage in .NET applications. It enables .NET developers to detect various memory problems like memory leaks, understand how their code uses memory, and optimize their app's memory consumption.Key features of dotTrace Memory include:Detailed memory snapshots to understand...
Stackify Prefix is a performance monitoring and profiling tool designed for developers and IT operations teams. It provides deep visibility into applications to help identify performance bottlenecks, troubleshoot issues faster, and optimize code.Key features of Stackify Prefix include:Real-user monitoring to capture metrics like response time, throughput, and errorsCode-level profiling to...
ANTS Memory Profiler is a performance profiling tool used to optimize .NET applications by detecting memory leaks and identifying areas for code improvement. It provides detailed analysis of managed heap memory usage down to the line of code, helping .NET developers efficiently manage memory usage and application performance.Key features of...
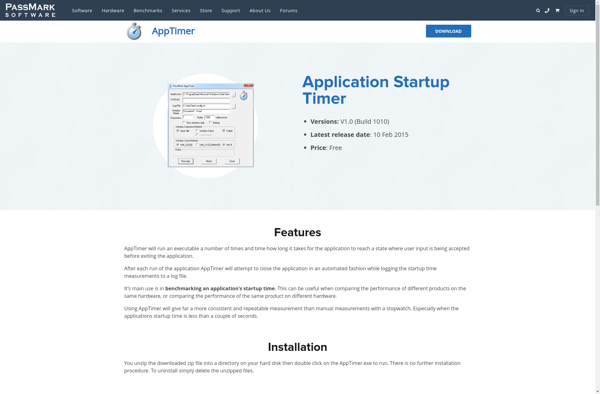
AppTimer is a comprehensive time tracking and productivity software designed to help professionals, freelancers, consultants, and small teams track their time accurately, monitor productivity, and bill clients easily. It provides the following key features:Intuitive manual time tracking with running timers to capture real-time work information and ensure accurate time logsIdle...