Affinic Debugger GUI
Affinic Debugger GUI: Visual Debugging Tool
Affinic Debugger GUI is a graphical user interface for the Affinic debugger. It allows developers to visually debug applications by setting breakpoints, stepping through code, and inspecting variables.
What is Affinic Debugger GUI?
Affinic Debugger GUI is a feature-rich graphical frontend for the Affinic command-line debugger. It provides developers with an intuitive way to debug their applications visually instead of working directly with debugging commands.
Some key features of Affinic Debugger GUI include:
- Setting breakpoints with a simple click on the relevant lines of code
- Stepping over, into, or out of functions during execution
- Inspecting and monitoring values of variables in real-time
- Evaluating custom expressions on-the-fly
- Viewing the call stack to understand the execution flow
- Customizable interface with support for themes and layout options
The graphical interface makes tasks like setting breakpoints visual and quick instead of having to remember specific commands. Variables and watches can be inspected by simply hovering over them instead of printing their values. The debugger seamlessly integrates with editors and provides a more natural debugging experience.
With its rich graphical capabilities and easy-to-use workflows, Affinic Debugger GUI can improve programmer productivity by reducing debugging effort. The intuitive visual interface is beginner-friendly but also offers advanced capabilities for experienced developers.
Affinic Debugger GUI Features
Features
- Graphical user interface for debugging
- Set breakpoints in code
- Step through code execution
- Inspect variables and values
- View call stack
- Watch expressions
- Control execution flow
Pricing
- Free
- Open Source
Pros
Cons
Official Links
Reviews & Ratings
Login to ReviewThe Best Affinic Debugger GUI Alternatives
View all Affinic Debugger GUI alternatives with detailed comparison →
Top Development and Debugging Tools and other similar apps like Affinic Debugger GUI
Here are some alternatives to Affinic Debugger GUI:
Suggest an alternative ❐Wingdb

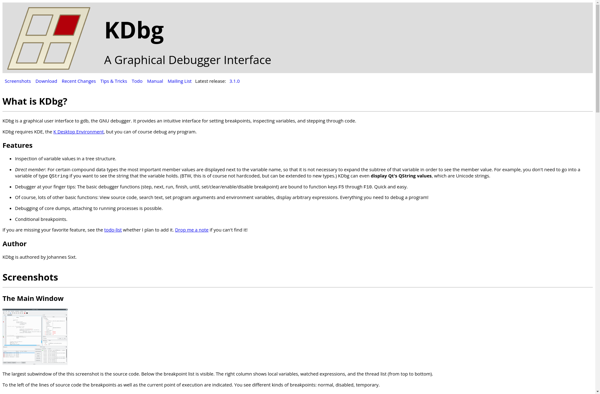
Kdbg
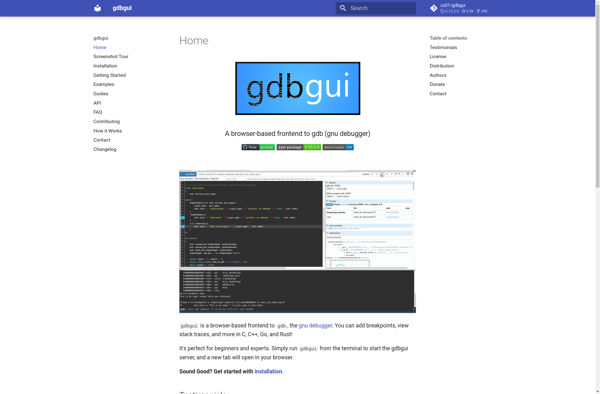
Gdbgui
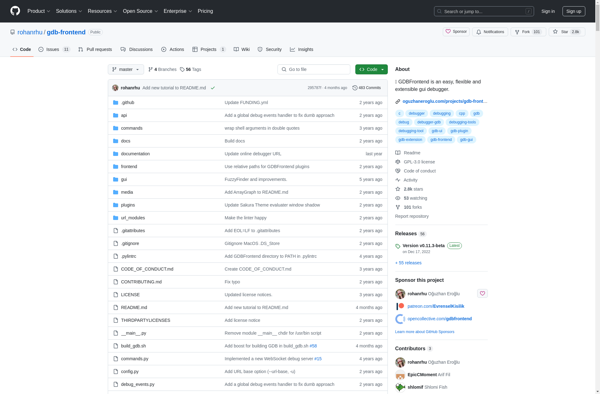
GDBFrontend