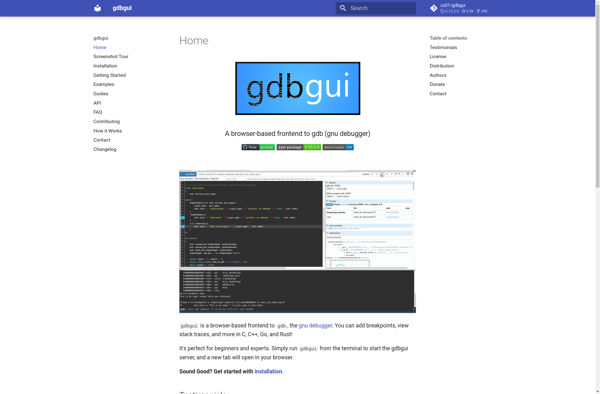
gdbgui is an open-source browser-based graphical user interface for debugging C, C++, Go, Rust, and other compiled programming languages using gdb. It allows setting breakpoints, visualizing the call stack and variables, etc. with just a browser.
gdbgui: Open-Source Browser-Based Debugger for C/C++/Go/Rust
gdbgui is an open-source browser-based graphical user interface for debugging C, C++, Go, Rust, and other compiled programming languages using gdb. It allows setting breakpoints, visualizing the call stack and variables, etc. with just a browser.
What is Gdbgui?
gdbgui is an open-source, browser-based graphical user interface for gdb - the GNU debugger. It allows debugging C, C++, Go, Rust, and other compiled programming languages through a user-friendly GUI, without needing to use gdb commands directly.
Some key features of gdbgui include:
Setting breakpoints visually
Inspecting variables and data structures
Visualizing the call stack and threads
Navigating through code using a source code viewer
Executing gdb commands through an integrated gdb console
gdbgui makes gdb much easier to use, especially for beginners learning debugging. The intuitive browser-based interface lowers the learning curve dramatically. Experienced developers can also benefit from improved workflows compared to working directly with gdb.
As an open-source tool under the GPL v3.0 license, gdbgui is free to use and extend. It is implemented in Python and JavaScript, leveraging modern web technologies. gdbgui aims to provide a simple yet powerful graphical frontend to harness the capabilities of gdb.
Gdbgui Features
Features
Browser-based GUI for gdb
Allows setting breakpoints
Visualizes call stack and variables
Supports C, C++, Go, Rust and other compiled languages
WingDB is a feature-rich Python debugger optimized for ease of use and integrating smoothly into Python development workflows. It works with all major Python implementations including CPython, PyPy, IronPython, and Jython.Some key capabilities and benefits of WingDB include:Remote debugging allowing debugging applications running on remote hosts, Docker containers, and in...
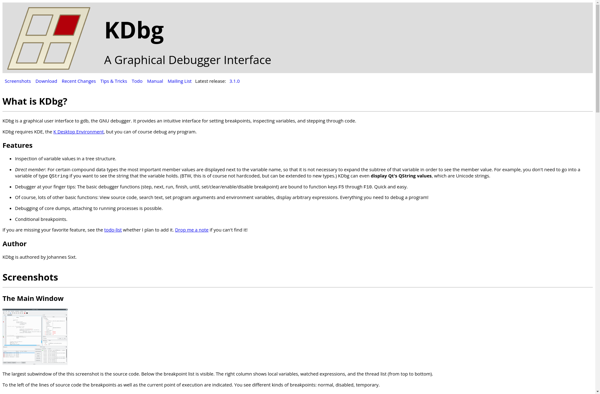
Kdbg is an open source graphical debugger interface for Linux. It provides a user-friendly interface for debugging applications and examining running programs.Some key features of Kdbg include:Setting breakpoints in code to pause executionStepping through code line-by-lineInspecting variables and memory to check program stateCustomizable interface with plugin supportIntegration with GDB for...
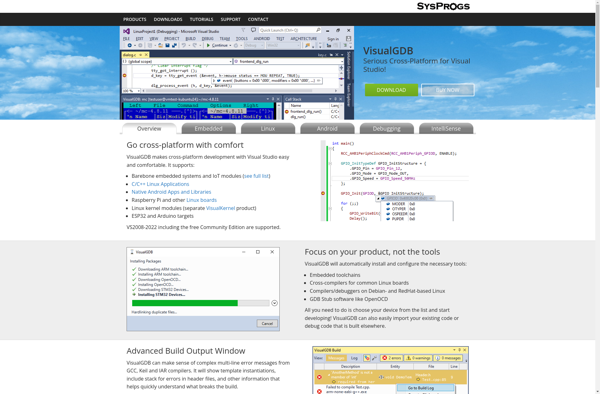
VisualGDB is an integrated development environment plugin for Microsoft Visual Studio designed specifically for developing, analyzing, and debugging embedded software systems written in C/C++. It aims to improve developer productivity by providing a seamless integration of advanced debugging and analysis capabilities within the familiar Visual Studio IDE.Key features of VisualGDB...
GNU Data Display Debugger (DDD) is a feature-rich graphical front-end to command-line debuggers such as GDB, DBX, WDB, Ladebug, JDB, XDB, the Perl debugger, the bash debugger, and the Python debugger. It is capable of visually debugging programs written in C, C++, Fortran, Go, Rust, Assembly, and other languages. Some...
Affinic Debugger GUI is a feature-rich graphical frontend for the Affinic command-line debugger. It provides developers with an intuitive way to debug their applications visually instead of working directly with debugging commands.Some key features of Affinic Debugger GUI include:Setting breakpoints with a simple click on the relevant lines of codeStepping...
GDBFrontend is an open-source graphical frontend for the GNU Debugger (GDB). It aims to make debugging programs easier by providing a more intuitive user interface compared to GDB's traditional command line interface.Key features of GDBFrontend include:Graphical interface with menus, buttons, and views for variables, breakpoints etc.Easy to use, no need...
Nemiver is an open-source, graphical debugger for debugging native C/C++ applications. It aims to provide a simple yet powerful user interface for debugging that integrates tightly with the GNU Debugger (GDB).Some key features of Nemiver include:Setting breakpointsStepping through code one line at a timeInspecting variables and expressionsExamining the call stack...