VisualGDB
VisualGDB: Integrated Development Environment for C/C++ Debugging
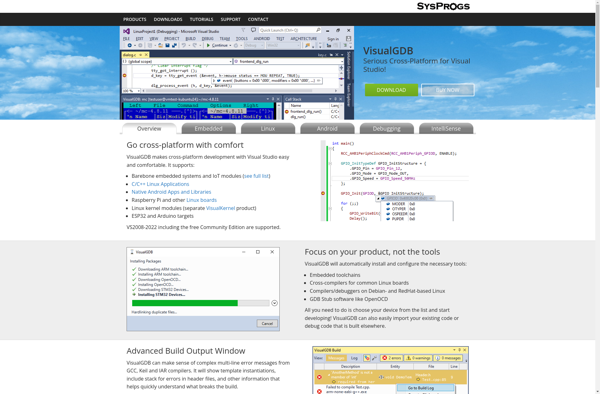
VisualGDB is an integrated development environment designed specifically for debugging and analyzing embedded software written in C or C++. It integrates with Visual Studio and provides features like register and memory viewers, real-time code debugging, static analysis, and more to help developers optimize and troubleshoot embedded systems.
What is VisualGDB?
VisualGDB is an integrated development environment plugin for Microsoft Visual Studio designed specifically for developing, analyzing, and debugging embedded software systems written in C/C++. It aims to improve developer productivity by providing a seamless integration of advanced debugging and analysis capabilities within the familiar Visual Studio IDE.
Key features of VisualGDB include:
- Seamless integration into Visual Studio - no need to switch between separate tools
- Support for leading embedded architectures like Arm, X86, RISC-V, and more
- Advanced debug capabilities like full-featured register, memory, peripheral viewers
- Multi-process and multi-core debugging
- Static and runtime analysis to catch bugs and errors
- Task awareness and visualization
- Customizable device configuration for defining hardware setup
- Broad compatibility with compilers, debuggers, IDEs
By bringing advanced low-level visibility and control into Visual Studio, VisualGDB aims to significantly improve developer productivity working on embedded systems. The intuitive user interface, rich analysis capabilities, and seamless IDE integration makes VisualGDB a compelling solution for organizations looking to streamline their embedded software workflows.
VisualGDB Features
Features
- Integrated debugger for ARM Cortex-M and RISC-V cores
- Register and memory viewers
- Static and runtime analysis
- Project wizard for embedded projects
- Integration with IDEs like Visual Studio, Eclipse, etc.
Pricing
- Free limited version
- Subscription-based for individuals and teams
Pros
Cons
Official Links
Reviews & Ratings
Login to ReviewThe Best VisualGDB Alternatives
View all VisualGDB alternatives with detailed comparison →
Top Development and Embedded Systems and other similar apps like VisualGDB
Wingdb
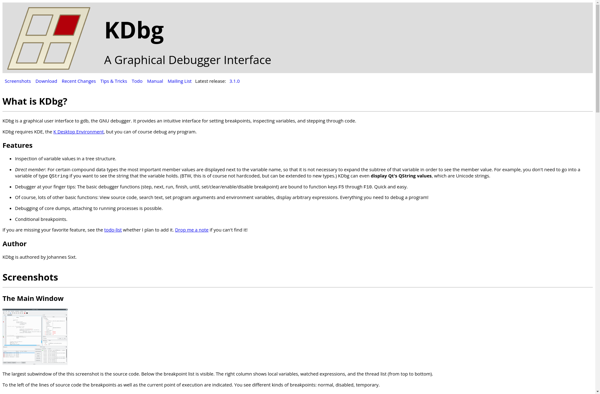
Kdbg
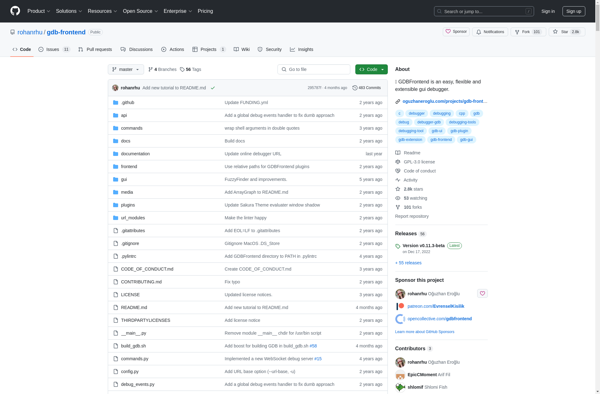
Gdbgui
GDBFrontend