Wingdb

WingDB: Python Debugger
WingDB is a Python debugger focused on ease of use, flexibility, and performance. It is designed for use in web development, data science, and other Python programming contexts. WingDB features remote debugging, conditional breakpoints, watch expressions, multi-process debugging, Django debugging, and integration with coding tools like PyCharm.
What is Wingdb?
WingDB is a feature-rich Python debugger optimized for ease of use and integrating smoothly into Python development workflows. It works with all major Python implementations including CPython, PyPy, IronPython, and Jython.
Some key capabilities and benefits of WingDB include:
- Remote debugging allowing debugging applications running on remote hosts, Docker containers, and in the cloud
- Conditional breakpoints for more precise control over where execution stops
- Data watches for tracking values of expressions as code executes
- Multi-process and multi-threaded debugging
- Django debugging with auto-detection of Django projects
- Integration with coding tools like PyCharm and Visual Studio Code
- A responsive and intuitive debugger UI focused on Python developers' needs
- Good performance with low overhead analysis and instrumentation
- Scriptable CLI interface for integration into automated workflows
With its balance of usability, flexibility, and performance WingDB is a great choice for Python developers working on web applications, analytics and data science projects, systems programming, or any domain involving significant Python code.
Wingdb Features
Features
- Remote debugging
- Conditional breakpoints
- Watch expressions
- Multi-process debugging
- Django debugging
- Integration with coding tools like PyCharm
Pricing
- Subscription-Based
Pros
Cons
Official Links
Reviews & Ratings
Login to ReviewThe Best Wingdb Alternatives
View all wingdb alternatives with detailed comparison →
Top Development and Debugging and other similar apps like Wingdb
Here are some alternatives to Wingdb:
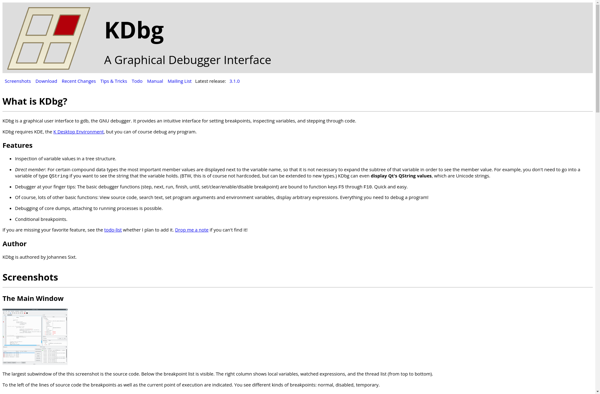
Suggest an alternative ❐Kdbg
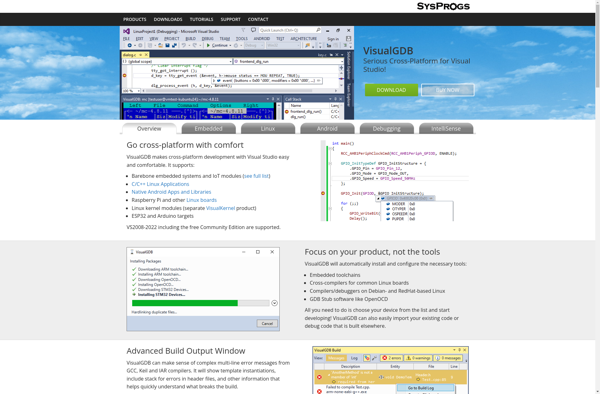
VisualGDB
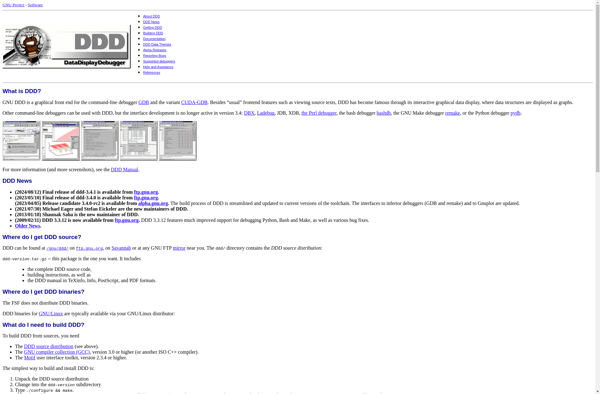
GNU Data Display Debugger
Affinic Debugger GUI

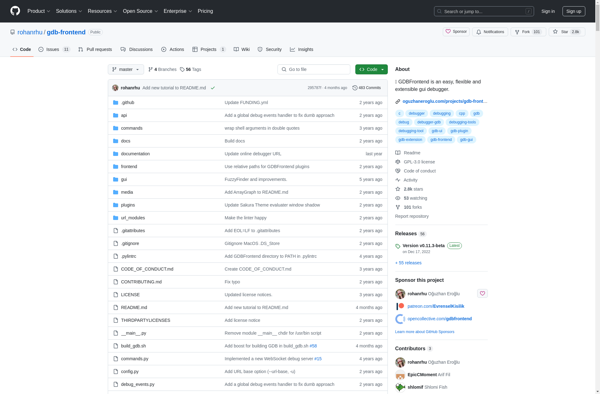
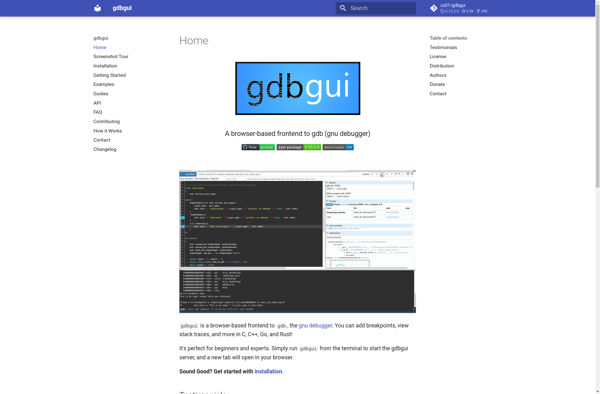
Gdbgui
GDBFrontend