GNU Data Display Debugger
GNU Data Display Debugger (Visual Debugger for Command-Line Debuggers)
A graphical front-end for command-line debuggers like GDB, allowing visually debugging programs in C, C++, and other languages, with features such as variable value visualization, stepping through code, breakpoint setting, and more.
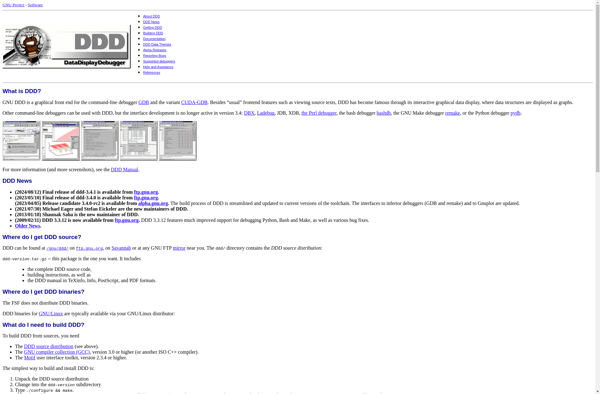
What is GNU Data Display Debugger?
GNU Data Display Debugger (DDD) is a feature-rich graphical front-end to command-line debuggers such as GDB, DBX, WDB, Ladebug, JDB, XDB, the Perl debugger, the bash debugger, and the Python debugger. It is capable of visually debugging programs written in C, C++, Fortran, Go, Rust, Assembly, and other languages. Some of DDD's major features include:
- Graphical user interface with multiple windows and views for source code, variables, threads, breakpoints, etc.
- Support for multiple concurrent debugging sessions
- Integration with GDB and other command-line debuggers as back-ends
- Graphical display of data structures and variables
- Step-by-step source code execution with breakpoints
- Inspect and modify variables and memory on-the-fly
- Launch and attach to running processes for debugging
- Integration with source code editors like Emacs and Vim
- Multi-threaded and parallel program debugging
- Scriptable using Python
DDD aims to provide an intuitive and productive debugging environment for various programming languages and debuggers. With a plugin framework, DDD can be extended to support additional back-ends and features. Its GUI helps visualize the debugging process and understand complex programs and data interactions.
GNU Data Display Debugger Features
Features
- Graphical user interface for debugging
- Integrated debugging of multi-threaded and real-time programs
- Multiple debugger support including GDB, DBX, WDB, Ladebug, JDB, XDB, the Perl debugger, the Python debugger, and others
- Visualization of data structures during debugging
- Breakpoints, stepping, and tracing through code
- Inspecting variables and memory
- Evaluating expressions
- Watching variables
- Disassembly display
- Source code browser
Pricing
- Open Source
Pros
Cons
Official Links
Reviews & Ratings
Login to ReviewNo reviews yet
Be the first to share your experience with GNU Data Display Debugger!
Login to ReviewThe Best GNU Data Display Debugger Alternatives
View all GNU Data Display Debugger alternatives with detailed comparison →
Top Development and Debugging Tools and other similar apps like GNU Data Display Debugger
Here are some alternatives to GNU Data Display Debugger:
Suggest an alternative ❐Wingdb
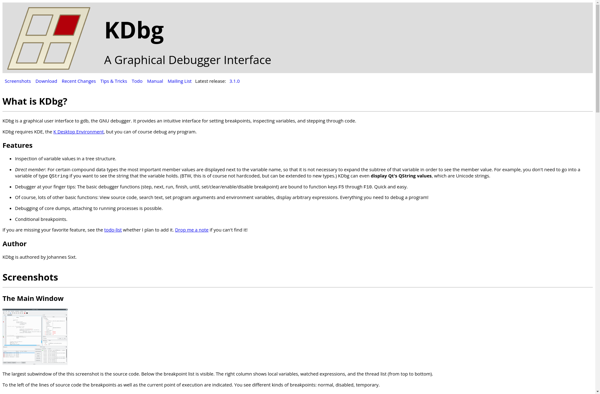
Kdbg
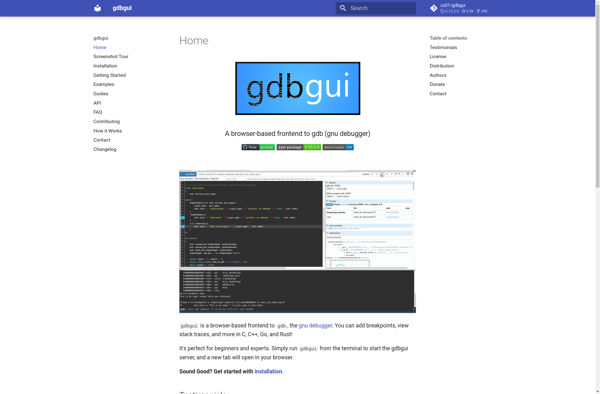
Gdbgui
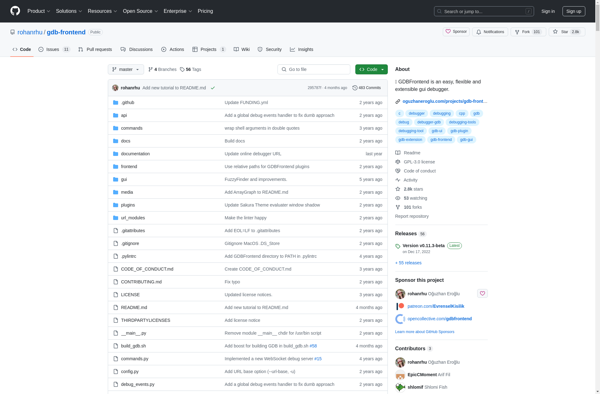
GDBFrontend
Nemiver