Nemiver
Nemiver: Open-Source GUI Debugger for C and C++ Applications
Nemiver is an open-source GUI debugger for applications written in C, C++, and other native languages. It integrates with the GNU Debugger (GDB) and allows setting breakpoints, stepping through code, inspecting variables, and more through a user-friendly graphical interface.
What is Nemiver?
Nemiver is an open-source, graphical debugger for debugging native C/C++ applications. It aims to provide a simple yet powerful user interface for debugging that integrates tightly with the GNU Debugger (GDB).
Some key features of Nemiver include:
- Setting breakpoints
- Stepping through code one line at a time
- Inspecting variables and expressions
- Examining the call stack and threads
- Watching variables to track value changes
- Integrated visualization for arrays, STL containers, Qt objects, etc.
Nemiver provides a clean, organized layout with separate panes for breakpoints, threads, variables, memory, expression evaluation, and more. The variable inspector allows drilling down into complex data structures. Graphical presentation of data makes debugging easier.
Under the hood, Nemiver is little more than a graphical front-end to the standard GDB debugger. It does not include its own debugging engine. This allows it to integrate smoothly into existing native Linux development workflows.
While useful for all native GUI and command-line applications, Nemiver is especially helpful for debugging large C/C++ applications with complex state. It can simplify analyzing bugs that are difficult to spot from GDB's traditional text-based interface.
Nemiver Features
Features
- Graphical user interface for debugging
- Integration with GDB
- Setting breakpoints
- Stepping through code
- Inspecting variables
- Watching variables
- Examining stack traces
- Debugging multithreaded applications
Pricing
- Open Source
Pros
Cons
Official Links
Reviews & Ratings
Login to ReviewThe Best Nemiver Alternatives
View all Nemiver alternatives with detailed comparison →
Top Development and Debugging and other similar apps like Nemiver
Here are some alternatives to Nemiver:
Suggest an alternative ❐Kdbg
GNU Data Display Debugger
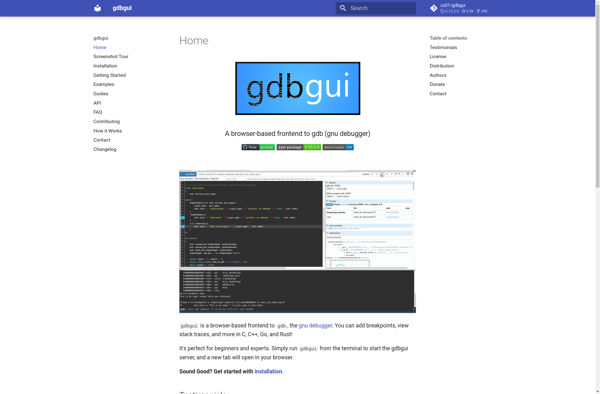
Gdbgui
GDBFrontend