DebugMe

DebugMe: Debugging & Performance Monitoring Tool
DebugMe is a debugging and performance monitoring tool for applications. It allows developers to easily insert logging, measure performance, track issues, and monitor application health in real-time.
What is DebugMe?
DebugMe is a powerful yet easy-to-use debugging and application performance monitoring tool. It provides comprehensive visibility into the runtime behavior of applications to accelerate finding and fixing issues.
With DebugMe, developers can quickly instrument logging to output debugging information without restarting the application. The logs provide insights into the application flow, values of variables, exceptions and more. Developers can search through historical logs to troubleshoot tricky issues.
In addition to logging, DebugMe allows measuring the performance of critical code paths. Developers can track metrics like method execution time, database queries, HTTP requests and more. The metrics overtime show if recent code changes have impacted performance.
DebugMe provides application health monitoring out-of-the-box. It can automatically detect and alert for problems like application crashes, performance degradation, high memory usage and more. The alerts help catch issues proactively before customers are impacted.
The DebugMe user interface makes all the information easily accessible. Developers can view graphs of metrics overtime, search logs, create custom alerts and more. Integration with popular notification channels like Slack, PagerDuty and Jira simplify collaborating with the operations team.
With its comprehensive debugging and monitoring capabilities presented through an intuitive interface, DebugMe increases developer productivity and application reliability.
DebugMe Features
Features
- Real-time monitoring and debugging
- Performance tracking and optimization
- Issue tracking and reporting
- Logging and error reporting
- Integrations with popular development tools
Pricing
- Free
- Freemium
- Subscription-Based
Pros
Cons
Official Links
Reviews & Ratings
Login to ReviewThe Best DebugMe Alternatives
View all DebugMe alternatives with detailed comparison →
Top Development and Debugging and other similar apps like DebugMe
Here are some alternatives to DebugMe:
Suggest an alternative ❐BugHerd
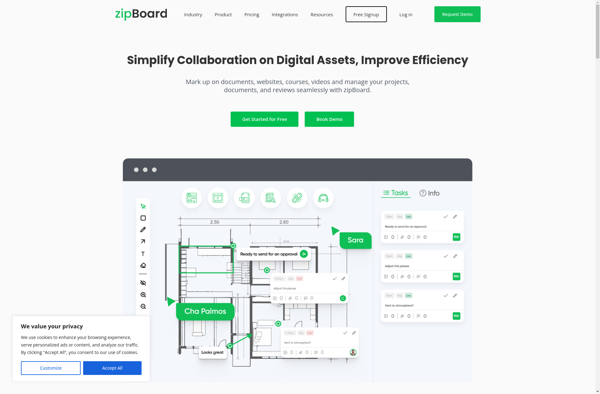
ZipBoard
Not8
Usersnap

Userback

Timeline.io
Survicate
Marker.io
Moqhub

GetFeedback
BugReplay

Bug Snapshot
QTrace

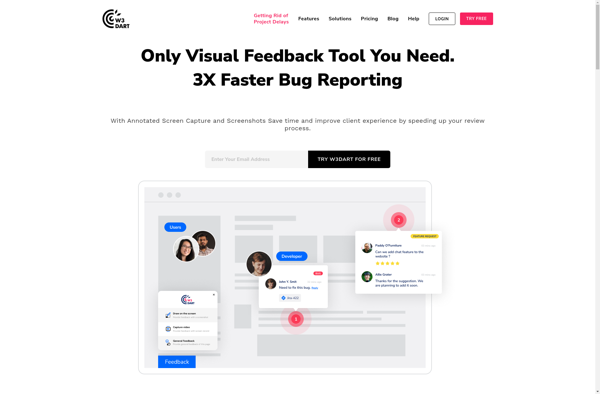
W3Dart
Flowcast

Kuoll
Webscope
