Getmathcharts.com
Getmathcharts.com: Free Online Graph Chart Creator
Generate customizable charts, graphs, and plots for presentations and analysis with Getmathcharts.com's intuitive interface
What is Getmathcharts.com?
Getmathcharts.com is a powerful yet easy-to-use free online graph, chart, and plot building application. With an intuitive drag-and-drop interface, it enables anyone to quickly create a wide variety of highly-customizable data visualizations including bar charts, line graphs, scatter plots, pie charts, area charts, dendrograms, heat maps, network diagrams, and more.
Whether you need to generate visuals for a report, presentation, scientific publication, or just to better understand your data, Getmathcharts.com has you covered. It supports uploading your own datasets, manually entering data, or generating randomized sample data to experiment with. Visual styling like colors, labels, legends, axes, and notes can be finely tuned.
Some key features include: support for multiple chart types to best represent different data; options to visualize hierarchical, networked, geospatial, and time-series data; sharing and embedding charts with custom URLs; and the ability to save and export charts as images or raw data files. With an ever-expanding set of customization options all available for free, Getmathcharts.com is the ideal online data visualization and graphing solution for students, educators, scientists, businesses, and beyond.
Getmathcharts.com Features
Features
- Create various chart types like bar charts, pie charts, line graphs, scatter plots
- Customizable charts with options to change colors, labels, scale, legend etc
- Add and style chart titles, axes labels
- Export charts as image files or embed in documents/presentations
- Supports mathematical and statistical chart options like histograms, box plots
- Intuitive drag and drop interface for rapidly building visualizations
- Online tool, no installation required
- Free to use with no login required
Pricing
- Free
Pros
Cons
Official Links
Reviews & Ratings
Login to ReviewThe Best Getmathcharts.com Alternatives
Top Education & Reference and Math & Science and other similar apps like Getmathcharts.com
Here are some alternatives to Getmathcharts.com:
Suggest an alternative ❐Google Calculator
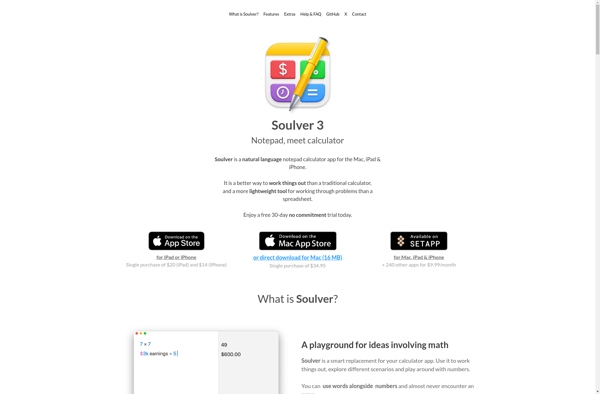
Soulver
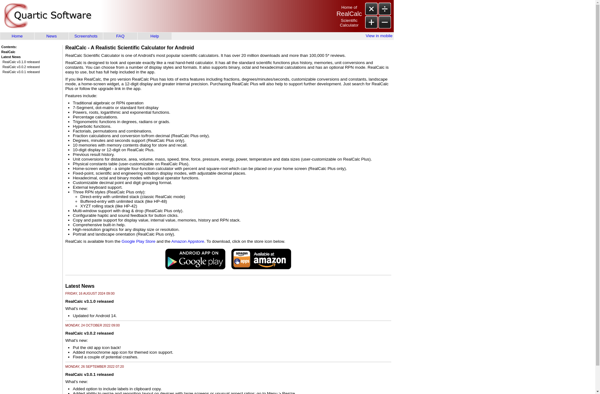
RealCalc Scientific Calculator
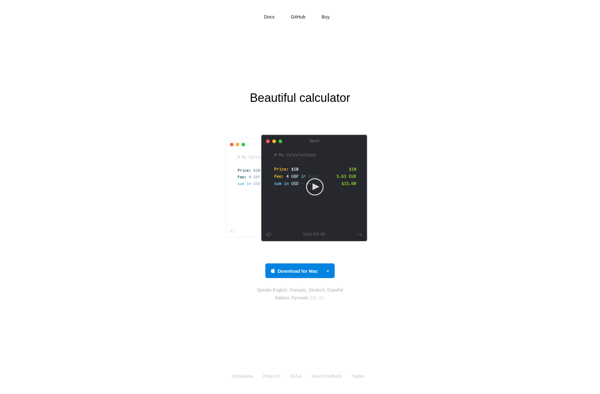
Numi
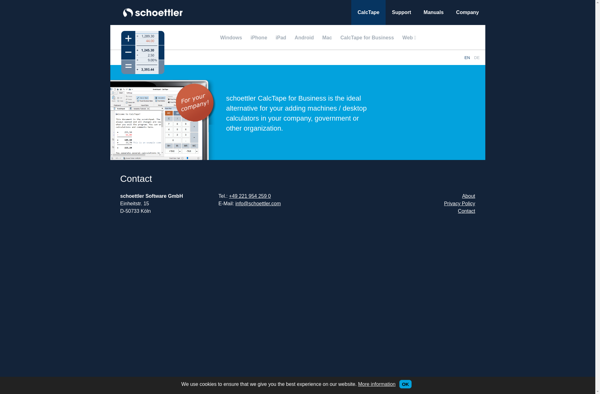
CalcTape
PCalc

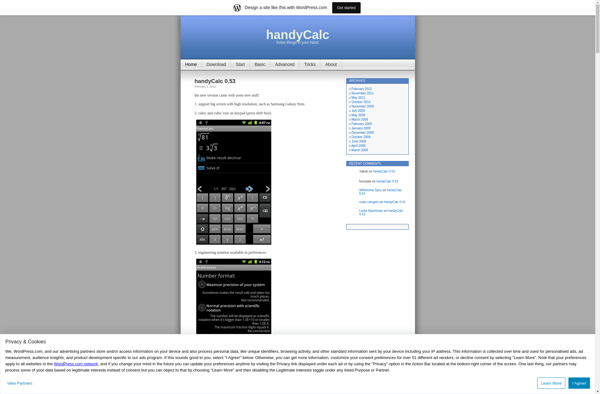
HandyCalc
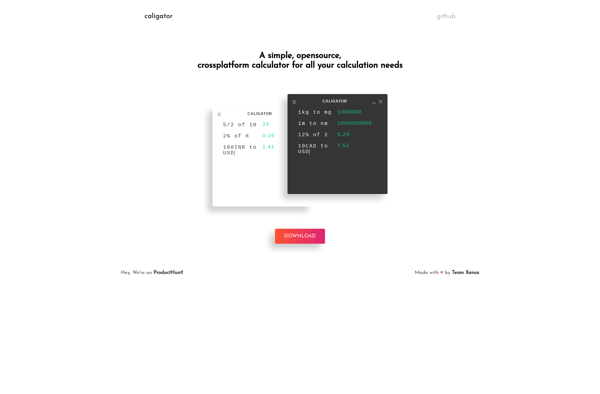
Caligator
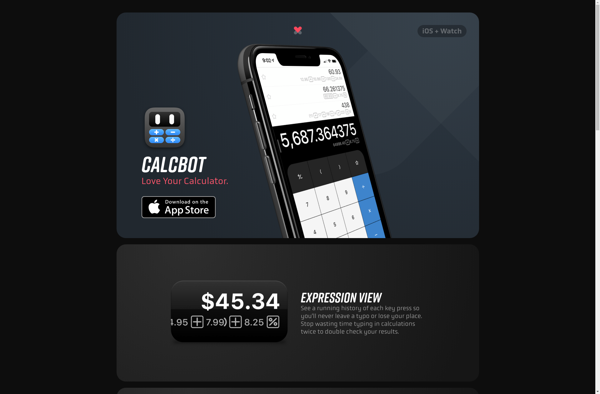
Calcbot
SpeQ Mathematics
Integral Calculator
NumWorks Graphing Calculator
