Indicative is a business intelligence and data analytics platform that helps companies analyze data to gain insights. It allows users to connect data from various sources, build dashboards and reports, track KPIs, and create data models.
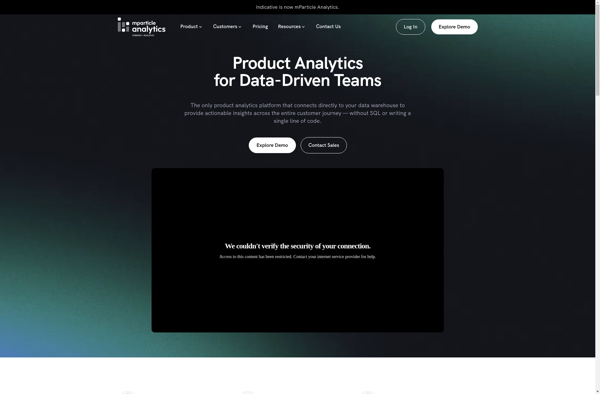
Indicative: Business Intelligence and Data Analytics Platform
Indicative is a business intelligence and data analytics platform that helps companies analyze data to gain insights. It allows users to connect data from various sources, build dashboards and reports, track KPIs, and create data models.
What is Indicative?
Indicative is a business intelligence and analytics software designed to help companies make data-driven decisions. It allows users to connect their data from various sources like databases, cloud apps, and more to create interactive dashboards and reports.
Some key features of Indicative include:
Data connectors to integrate data from sources like MySQL, Postgres, Salesforce, HubSpot, etc.
Drag-and-drop interface to build customizable dashboards with advanced visualizations like charts, tables, gauges, and more
Query editor to analyze data using SQL and create cohorts for segmentation
Alerts and scheduled reports to monitor KPIs and get notifications about changes
Collaboration tools to share insights across the organization
REST API and database connections to build custom apps and integrations
Role-based access control to manage permissions
Indicative serves companies across many industries like retail, finance, media, ecommerce, and more. Its intuitive interface makes it easy for non-technical users to analyze data while also providing advanced functionality for more technical users. The platform can scale to handle large data volumes as company data needs grow.
Indicative Features
Features
Data connectors to integrate data from various sources
Interactive dashboards and reports
KPI tracking
Data modeling and predictive analytics
Collaboration tools
Pricing
Freemium
Subscription-Based
Pros
Intuitive drag and drop interface
Prebuilt templates and workflows
Automated insights and recommendations
Scalability to handle large data volumes
Integration with BI tools like Tableau and Looker
Cons
Steep learning curve for beginners
Limitations in customization compared to open source options
Google Analytics is a free web analytics service offered by Google that tracks and reports website traffic. It is the most widely used web analytics service on the Internet.Some key features of Google Analytics include:Tracking number of visitors, page views, bounce rate, session duration, demographics, location, behavior and moreIn-depth analysis...
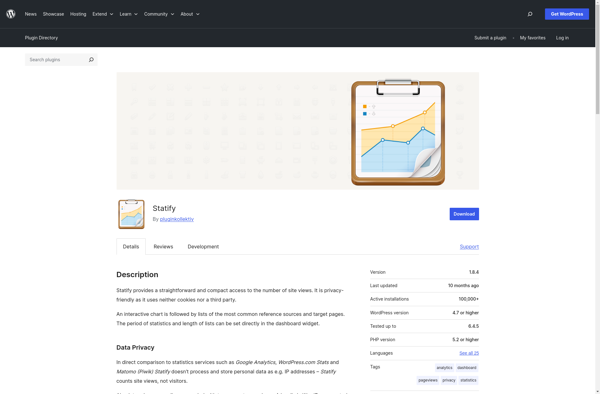
Statify is a user-friendly web analytics platform designed to help website owners, bloggers, and small business owners better understand their website traffic and visitor behavior. Some key features of Statify include:Intuitive dashboards and reports providing actionable insights on website visitors, traffic sources, popular content, and more.Real-time analytics allowing you to...
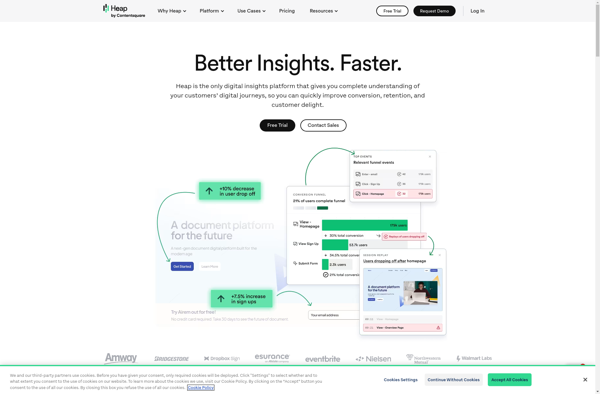
Heap Analytics is a robust user behavior analytics platform designed to help product and growth teams deeply understand how users interact with their digital products. It automatically captures every user action in your web or mobile application, allowing you to measure key metrics like funnels, retention cohorts, sticky features, and...
Segment is a customer data platform (CDP) that aims to help companies collect, store, analyze and activate their first-party customer data. Some key capabilities and benefits of Segment include:Data collection - Segment seamlessly connects to data sources like websites, mobile apps, CRM platforms, email tools, support tools and more to...
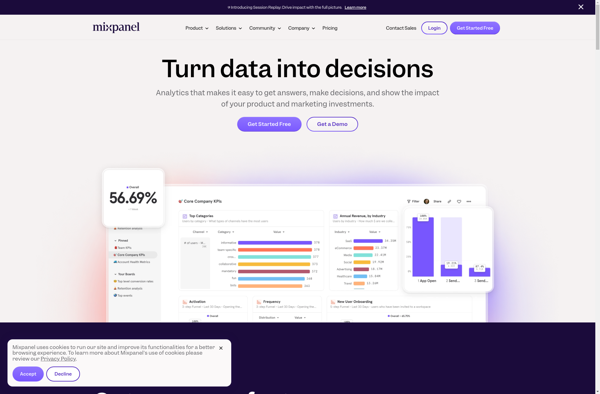
Mixpanel is a robust analytics platform used to analyze user engagement and behavior on websites, mobile apps, and other digital platforms. It provides key insights into audiences and user journeys by tracking actions taken on web and app interfaces, including clicks, taps, form submissions, transactions, media interactions, and more.Unlike basic...
AppLink.io is a flexible no-code automation platform designed to help teams build and connect custom internal tools and workflows. It provides an easy way to integrate your favorite cloud services like G Suite, Office 365, Salesforce, Slack, and more without needing developers or writing any code.With an intuitive drag-and-drop interface,...
Ghostboard is an open-source web-based kanban project management application similar to Trello. It allows teams to organize their work in boards that contain lists of cards representing tasks or items. Some key features of Ghostboard include:Flexible boards, lists, and cards for organizing work any way you wantDrag-and-drop support to easily...
Momentum.link is a browser extension available for Chrome, Firefox, Edge, and Opera that replaces boring new tab pages with a personalized dashboard to boost productivity and inspiration.Key features of Momentum include:To-do list to track tasks and goalsWeather information for your locationRotating background images and quotesPomodoro timer for time managementNotes sectionIntegration...
Jitsu is an open-source automation platform designed to help teams and organizations automate repetitive tasks and processes. It provides an intuitive drag-and-drop interface to build automation workflows without the need for coding knowledge.Key features of Jitsu include:Visual workflow designer - Easily build complex workflows by connecting pre-built activities together with...