RoughViz
roughViz: Hand-Drawn Styled Charts and Graphics
An open-source JavaScript library for creating sketchy/hand-drawn styled charts and graphics with minimal code, built on top of D3.js
What is RoughViz?
roughViz is an open-source JavaScript data visualization library that allows you to create sketchy, hand-drawn styled charts and graphics for web applications. It is built on top of D3.js and RoughJS and makes it easy to take standard SVG visualizations and give them a hand-drawn, sketched aesthetic.
Some key features and benefits of roughViz include:
- Lightweight library, easy to install and integrate
- Supports a variety of chart types including bar, line, pie, scatterplot, maps, and more
- Customizable sketch styles - control sketch color, fill weight, stroke width, randomness etc.
- Animated transitions between charts and graph states
- Works well with React, Vue, Angular and other web frameworks
- Can be styled with CSS and customized extensively
- MIT license - free for commercial and non-commercial use
roughViz allows developers to quickly take boring, standard data visualizations and give them a hand-drawn look and feel that stands out. It's great for adding visual interest to dashboards, reports, and data stories. The sketchy style can make data more approachable, memorable and engaging for viewers.
RoughViz Features
Features
- Creates sketchy, hand-drawn styled charts and graphics
- Built on top of D3.js visualization library
- Supports various chart types like bar, line, pie, scatterplot
- Customizable sketch styles and effects
- Animated transitions between charts
- Open-source and free to use
Pricing
- Open Source
Pros
Cons
Official Links
Reviews & Ratings
Login to ReviewThe Best RoughViz Alternatives
View all roughViz alternatives with detailed comparison →
Top Development and Data Visualization and other similar apps like RoughViz
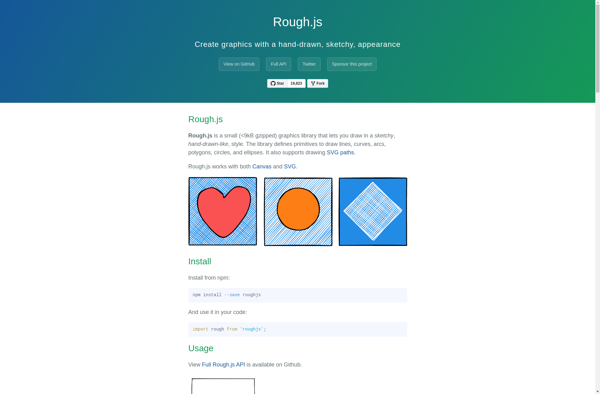
Rough.js
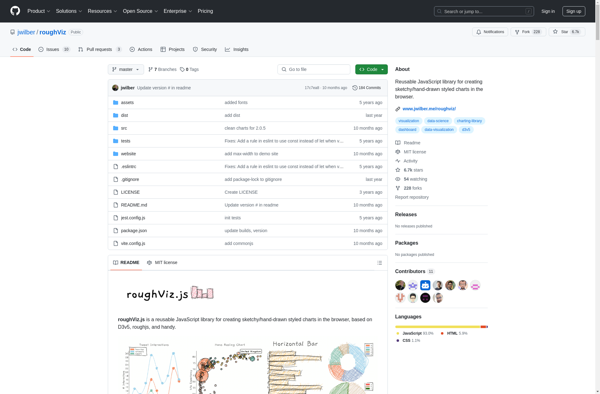
Rough Charts
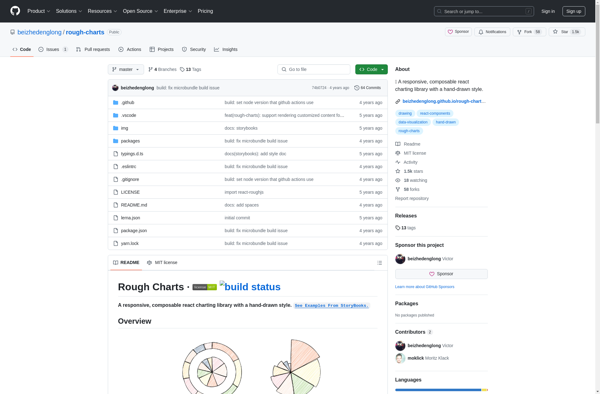
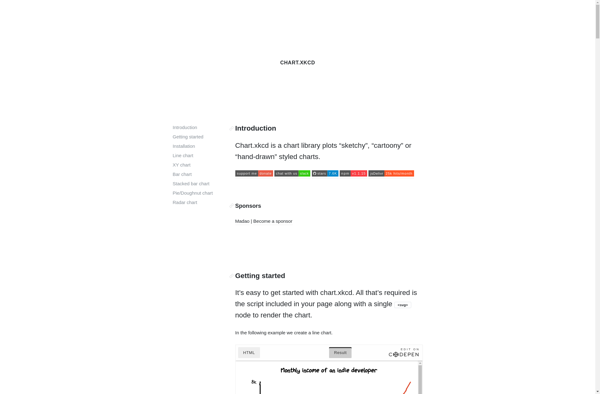
Chart.xkcd