Chart.xkcd
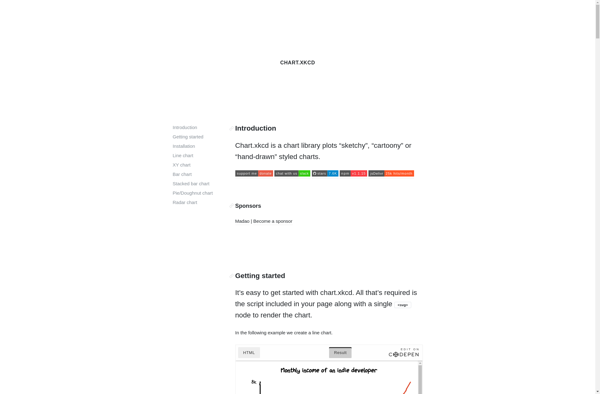
Chart.xkcd: Hand-Drawn Charting Library
A charting library that creates charts and graphs inspired by the hand-drawn style of xkcd comics, injecting humor and visual interest into data visualizations.
What is Chart.xkcd?
Chart.xkcd is an open-source JavaScript charting library that creates charts and graphs inspired by the simple, hand-drawn style of diagrams seen in the popular xkcd webcomic. Developed by timber.io, Chart.xkcd seeks to provide a more informal, playful alternative to traditional data visualization libraries.
While not suitable for presentations or publication-quality graphics, Chart.xkcd is ideal for making lightweight, approachable charts that inject personality and humor into digital projects. Its intentionally sketchy look aims to humanize data and make it more relatable. The library supports various common chart types like line, bar, scatterplot, and pie charts.
Some key features include:
- Support for line, bar, column, area, scatterplot, timeline and pie charts
- Options for customizing colors, stroke width, padding, axis lines and labels
- Zoom functionality for scatterplots and timelines
- A simple, clean API for programmatic chart generation
- SVG output for cross-browser compatibility
Overall, Chart.xkcd is a fun and offbeat library for creating charming charts that stray from the often cold and robotic look of traditional dataviz tools. Its distinctive style is playful while still being perceptible and functional.
Chart.xkcd Features
Features
- Creates charts and graphs with hand-drawn, sketchy visual style
- Supports various chart types like line, bar, scatterplot, pie, etc
- Renders charts as SVG for inclusion in web pages and apps
- Built on D3.js data visualization library
- Open source JavaScript library
Pricing
- Open Source
Pros
Cons
Official Links
Reviews & Ratings
Login to ReviewThe Best Chart.xkcd Alternatives
View all Chart.xkcd alternatives with detailed comparison →
Top Data Visualization and Humorous and other similar apps like Chart.xkcd
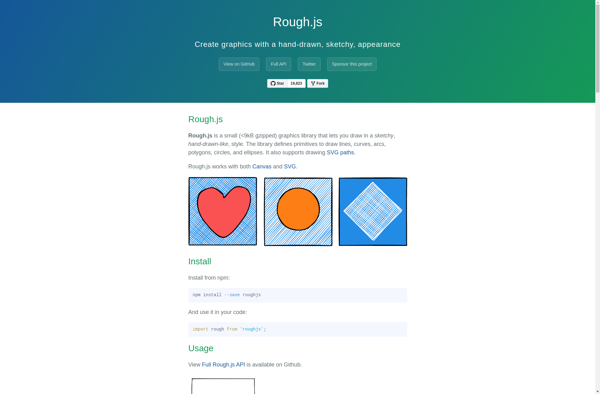
Rough.js
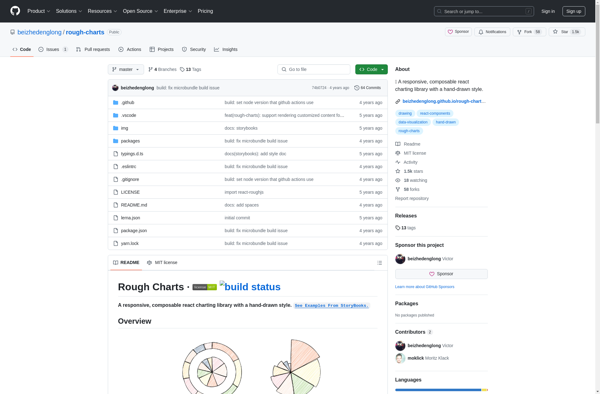
Rough Charts
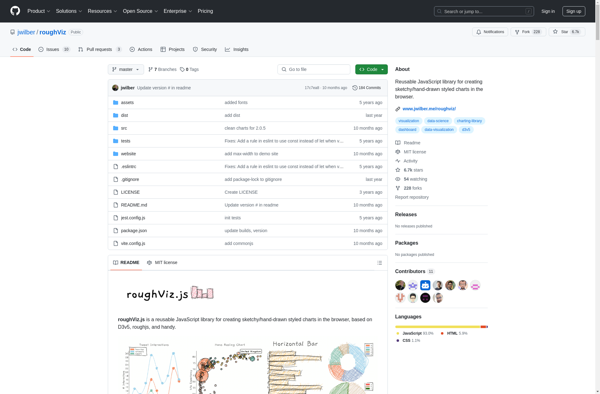
RoughViz