Tiny JavaScript Debugger

Tiny JavaScript Debugger: Lightweight Open Source Browser Debugger
A free online tool for debugging JavaScript code in the browser, featuring breakpoints, stepping through code, variable inspection, and call stack analysis.
What is Tiny JavaScript Debugger?
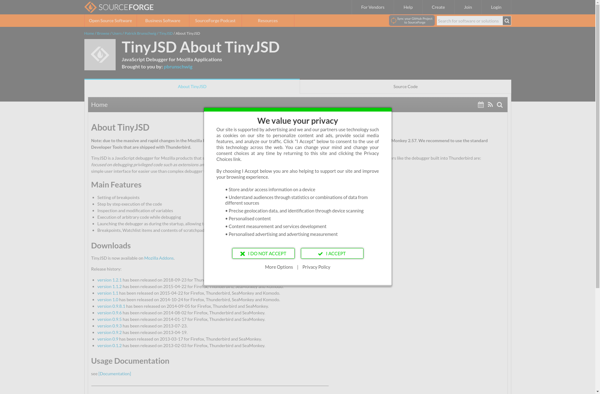
Tiny JavaScript Debugger (TJD) is an open source lightweight JavaScript debugger that allows developers to debug JavaScript code directly in the browser. It provides key debugging features including:
- Setting breakpoints in JavaScript code
- Stepping through code line-by-line to understand execution flow
- Inspecting values of variables and expressions in the current execution context
- Viewing and exploring the call stack to understand how functions were invoked
As a lightweight client-side debugger, TJD does not require any extensions, plugins or changes to backend code. It injects a small debugging script into the page and communicates directly with the browser. This makes it easy for developers to start debugging JavaScript issues quickly.
TJD provides a simple user interface showing the JS source code, breakpoints, current execution line and variable values. Developers can use keyboard shortcuts to control stepping and breakpoints right from their IDE. The minimal UI keeps the focus on understanding the code without unnecessary debugger panels getting in the way.
With its tiny footprint and browser-based approach, TJD makes JavaScript debugging seamless. It's especially useful for front-end developers working with frameworks like React, Vue, and Angular. If you need to quickly debug a JavaScript issue in the browser, TJD is a great open source tool to use.
Tiny JavaScript Debugger Features
Features
- Lightweight and easy to use
- Supports breakpoints
- Step through code execution
- Inspect variables and call stack
- Open source
Pricing
- Open Source
Pros
Cons
Reviews & Ratings
Login to ReviewThe Best Tiny JavaScript Debugger Alternatives
View all Tiny JavaScript Debugger alternatives with detailed comparison →
Top Development and Debugging Tools and other similar apps like Tiny JavaScript Debugger
Here are some alternatives to Tiny JavaScript Debugger:
Suggest an alternative ❐Omnibug

Firefox Developer Tools

Javascript Debugger (Venkman)
