TouchDraw

TouchDraw

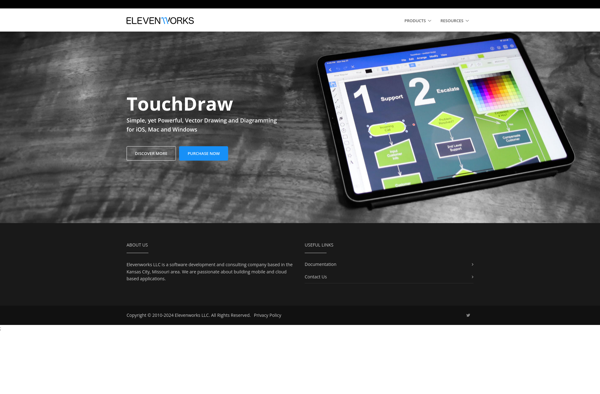
TouchDraw is a vector graphics editor designed specifically for touchscreen devices like iPads and Android tablets. It allows users to create diagrams, illustrations, flowcharts, UI mockups, website wireframes and more using a touch-based interface and vector tools.
TouchDraw image
vector graphics drawing diagram flowchart mockup wireframe

TouchDraw: Vector Graphics Editor for Touchscreen Devices

A touchscreen-friendly vector graphics editor for creating diagrams, illustrations, UI mockups and more on iPads and Android tablets.

What is TouchDraw?

TouchDraw is a vector graphics and diagramming app made specifically for touchscreen devices like iPads, Android tablets, and Windows touchscreen PCs. It provides an intuitive touch-based interface for creating all kinds of graphics and diagrams on the go.

Some key features of TouchDraw include:

  • Vector drawing tools like paths, shapes, text, connectors for diagramming flowcharts, wireframes, UML diagrams, mind maps, org charts, floorplans and more
  • An easy-to-use touch interface with smart shape recognition
  • One-touch auto alignment and distribution of objects
  • Dynamic connectors that adapt when endpoints are moved
  • Layers, grouping, lock functions
  • Import of PDF, SVG, JPG, transparency support
  • Export to SVG, PDF, PNG, JPEG, clipboard
  • iCloud Drive and Dropbox support for file syncing across devices

With its specialized feature set aimed at touch devices, TouchDraw provides a natural and intuitive way to create graphics, diagrams, and sketches on an iPad or Android tablet. Its tools are optimized for fingertip-based drawing rather than mouse-based computer drawing. If you need to create diagrams, charts, illustrations and drawings on the go from a tablet device rather than being limited to a desktop, TouchDraw is an excellent choice to consider.

TouchDraw Features

Features

  1. Vector drawing tools
  2. Shape recognition
  3. Multi-touch gestures
  4. Layers
  5. Import/export SVG files
  6. iCloud sync

Pricing

  • One-time Purchase
  • Subscription-Based

Pros

Intuitive touch-based interface

Powerful vector drawing capabilities

Useful for diagrams, illustrations, UI mockups

Syncs across devices via iCloud

Cons

Limited to touchscreen devices

Less features than desktop vector editors

No native PDF export


The Best TouchDraw Alternatives

Top Photos & Graphics and Illustration & Drawing and other similar apps like TouchDraw


Microsoft Office Visio icon

Microsoft Office Visio

Microsoft Office Visio is diagramming and vector graphics software developed by Microsoft. It is used to create a wide variety of business diagrams and visualizations including flowcharts, organizational charts, network diagrams, workflows, floorplans, and more.Key features of Visio include:Hundreds of professionally-designed templates for quick diagram creationIntuitive drag-and-drop interface to easily...
Microsoft Office Visio image
Lucidchart icon

Lucidchart

Lucidchart is a cloud-based diagramming application that allows users to collaborate and share diagrams in real time. It is used by over 30 million users and integrates with popular applications like Google Workspace, Microsoft Office 365, Confluence, and Jira.With an intuitive drag-and-drop interface, Lucidchart makes it easy for anyone to...
Lucidchart image
SmartDraw icon

SmartDraw

SmartDraw is a leading diagramming and visualization software used by over 1 million professionals and businesses. It provides an intuitive drag-and-drop interface to easily create over 70 types of diagrams like flowcharts, organizational charts, mind maps, project charts, floor plans, and more.SmartDraw stands out for its powerful automatic formatting and...
SmartDraw image
OmniGraffle icon

OmniGraffle

OmniGraffle is a powerful, versatile diagramming application developed by The Omni Group for macOS and iOS. First released in 2001, OmniGraffle enables users to create a wide range of diagrams, charts, illustrations, and graphic documents.With an intuitive and flexible interface, OmniGraffle makes it easy to quickly map out concepts, ideas,...
OmniGraffle image
YEd Graph Editor icon

YEd Graph Editor

yEd Graph Editor is a free, powerful desktop application for Windows, macOS and Linux that can be used to quickly and easily create diagrams. It supports a wide range of diagram types including flowcharts, network diagrams, UML diagrams, BPMN diagrams, mind maps, organization charts, and more.Some key features of yEd...
YEd Graph Editor image
Pencil Project icon

Pencil Project

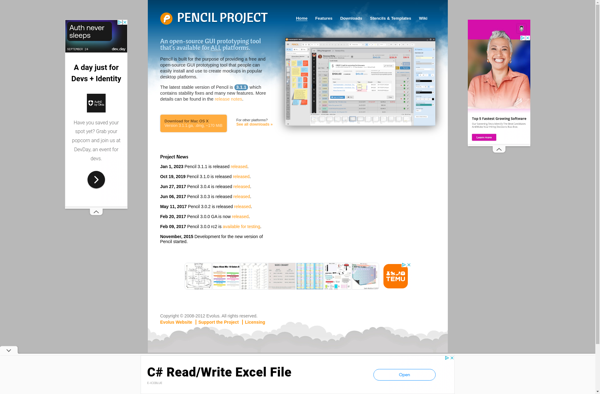
Pencil Project is a free and open source tool for creating GUI prototypes and mockups for applications and websites. It allows users to rapidly create wireframes and prototypes to visualize designs and layout concepts without any programming knowledge.Key features of Pencil Project include:An easy-to-use graphical interface for quick mockup generationTools...
Pencil Project image
PathVisio icon

PathVisio

PathVisio is an open-source software tool for drawing, editing, analyzing, and publishing biological pathways. It is developed by the PathVisio development team at the University of Maastricht in the Netherlands.Key features of PathVisio include:Intuitive drawing tools to create pathway diagramsSupport for importing pathways from databases like WikiPathways and KEGGData visualization...
PathVisio image
MyDraw icon

MyDraw

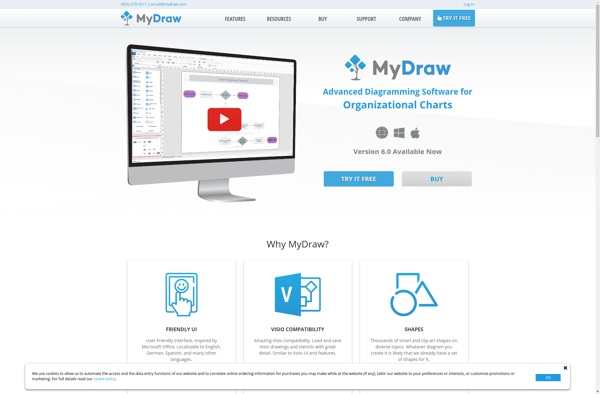
MyDraw is a free, open-source vector graphics editor available for Windows, Mac and Linux operating systems. It provides a complete set of vector drawing tools that allow users of all skill levels to create stunning 2D illustrations, diagrams, charts, logos and more.Although MyDraw is free software, its features and capabilities...
MyDraw image
Visual Understanding Environment icon

Visual Understanding Environment

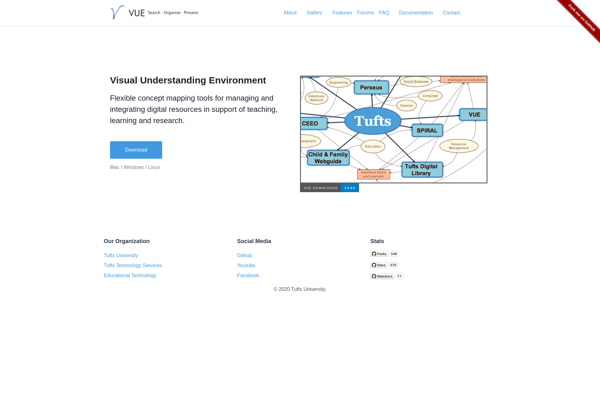
The Visual Understanding Environment (VUE) is an open-source data visualization application developed by the Academic Technology group at Tufts University. VUE provides users with the ability to visualize, analyze, and present complex data in an easy-to-use interface.Some key features of VUE include:Interactive 2D and 3D data visualizationSupport for multiple data...
Visual Understanding Environment image
Diagram.codes icon

Diagram.codes

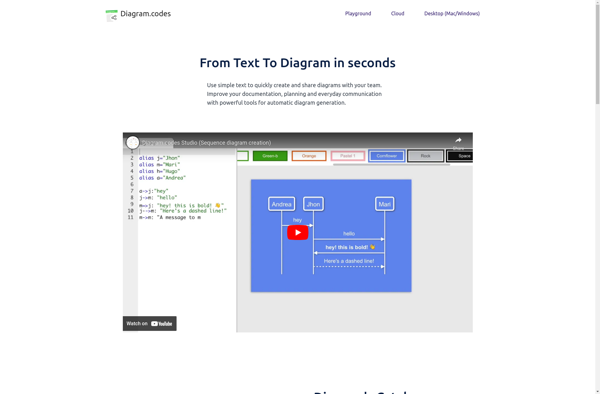
Diagram.codes is a free online diagramming and prototyping tool used by over 4 million people globally. It allows users to easily create a variety of diagrams including flowcharts, wireframes, UML diagrams, network diagrams, mind maps, and more. The intuitive drag-and-drop interface provides various shapes, connectors, and diagram templates to get...
Diagram.codes image
ClickCharts icon

ClickCharts

ClickCharts is a business intelligence and data visualization software used to create dashboards, charts, and graphs to gain meaningful insights from data. Some key features of ClickCharts include:Drag and drop interface to easily build interactive visualizations like charts, graphs, gauges, maps, and moreLarge library of chart types including bar, pie,...
ClickCharts image