PathVisio is an open-source biological pathway analysis and drawing software. It allows users to visualize, edit, analyze, and publish biological pathways and networks with intuitive drawing tools, statistics, and data integration.
An open-source software for visualizing, editing, analyzing, and publishing biological pathways and networks with intuitive drawing tools, statistics, and data integration.
What is PathVisio?
PathVisio is an open-source software tool for drawing, editing, analyzing, and publishing biological pathways. It is developed by the PathVisio development team at the University of Maastricht in the Netherlands.
Key features of PathVisio include:
Intuitive drawing tools to create pathway diagrams
Support for importing pathways from databases like WikiPathways and KEGG
Data visualization by mapping experimental data onto pathways
Built-in statistics to identify relevant pathways and interactions
Ability to edit and extend existing pathways with new interactions
Integration with Cytoscape for advanced network analysis
Export pathways to standard formats like GPML, PNG and SVG
Plugin architecture to extend functionality
Free and open-source under Apache 2.0 license
PathVisio allows researchers to better understand biological pathways, identify meaningful patterns in omics datasets, and generate high-quality pathway diagrams for publications. Its intuitive user interface, open architecture and active development community make PathVisio a useful toolkit for systems biologists, bioinformaticians and life science researchers.
PathVisio Features
Features
Drawing and editing biological pathways
Support for standard pathway and network formats like SBGN, SBML, PSI-MI
Data visualization and analysis
Plugin architecture to extend functionality
Integration with databases like Wikipathways, KEGG, Reactome
Pricing
Open Source
Pros
Free and open source
Intuitive and easy to use interface
Support for community curated pathways
Extensive import/export options
Customizable and extensible via plugins
Cons
Limited built-in statistical analysis
Steep learning curve for advanced features
Not as full-featured as some commercial alternatives
Microsoft Office Visio is diagramming and vector graphics software developed by Microsoft. It is used to create a wide variety of business diagrams and visualizations including flowcharts, organizational charts, network diagrams, workflows, floorplans, and more.Key features of Visio include:Hundreds of professionally-designed templates for quick diagram creationIntuitive drag-and-drop interface to easily...
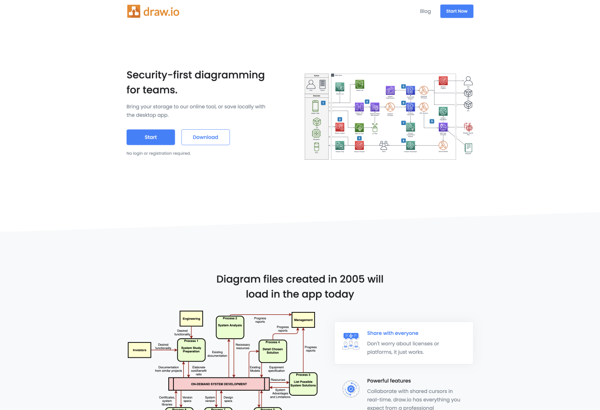
draw.io is a feature-rich diagramming and flowchart software that runs in your web browser. As a freemium tool, draw.io offers a free basic version as well as paid plans with more functionality for professionals and teams.With an intuitive drag-and-drop interface and built-in shape libraries, draw.io makes it easy for anyone...
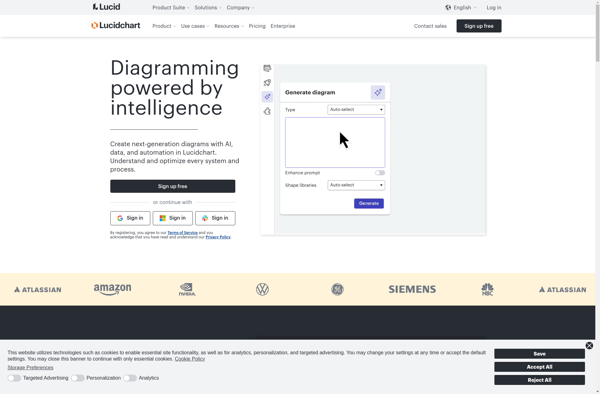
Lucidchart is a cloud-based diagramming application that allows users to collaborate and share diagrams in real time. It is used by over 30 million users and integrates with popular applications like Google Workspace, Microsoft Office 365, Confluence, and Jira.With an intuitive drag-and-drop interface, Lucidchart makes it easy for anyone to...
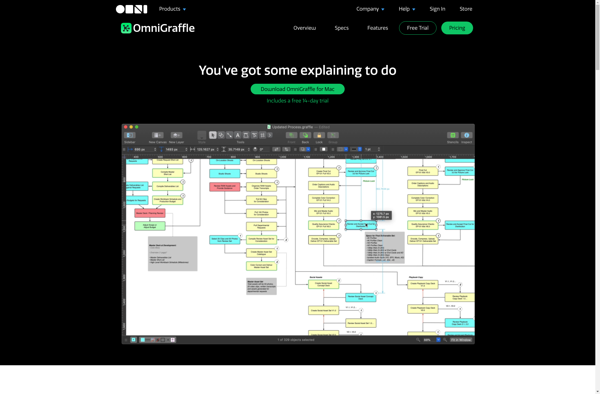
OmniGraffle is a powerful, versatile diagramming application developed by The Omni Group for macOS and iOS. First released in 2001, OmniGraffle enables users to create a wide range of diagrams, charts, illustrations, and graphic documents.With an intuitive and flexible interface, OmniGraffle makes it easy to quickly map out concepts, ideas,...
PlantUML is an open-source tool used for rapidly creating UML diagrams from a plain text language. It supports all standard UML diagrams like use case diagrams, component diagrams, class diagrams, sequence diagrams, state diagrams, activity diagrams, etc. The main goal of PlantUML is to provide a simple and efficient way...
Google Drawings is a free online diagramming and charting tool offered by Google as part of its Google Workspace productivity suite. It allows users to create flowcharts, organizational charts, mind maps, concept maps, site maps, and other types of diagrams.Some key features of Google Drawings include:Intuitive drag-and-drop interface for easily...
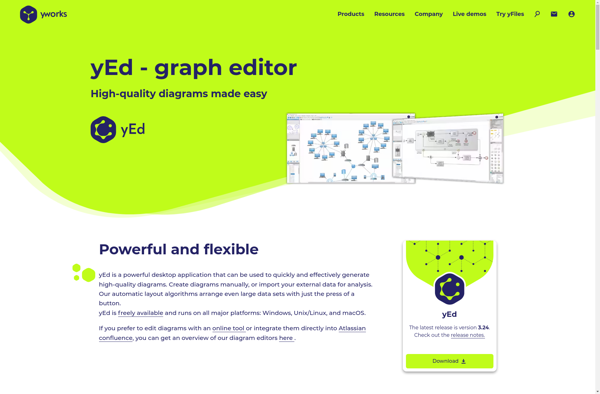
yEd Graph Editor is a free, powerful desktop application for Windows, macOS and Linux that can be used to quickly and easily create diagrams. It supports a wide range of diagram types including flowcharts, network diagrams, UML diagrams, BPMN diagrams, mind maps, organization charts, and more.Some key features of yEd...
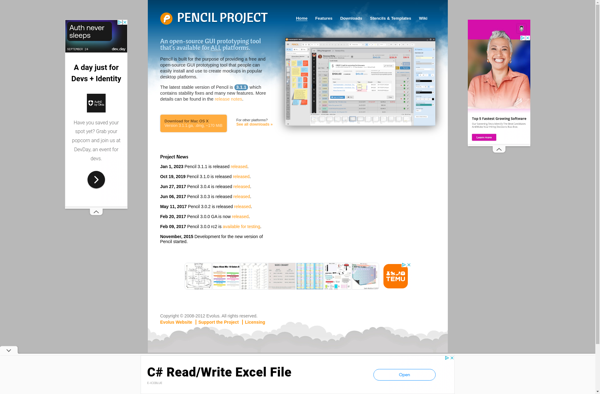
Pencil Project is a free and open source tool for creating GUI prototypes and mockups for applications and websites. It allows users to rapidly create wireframes and prototypes to visualize designs and layout concepts without any programming knowledge.Key features of Pencil Project include:An easy-to-use graphical interface for quick mockup generationTools...
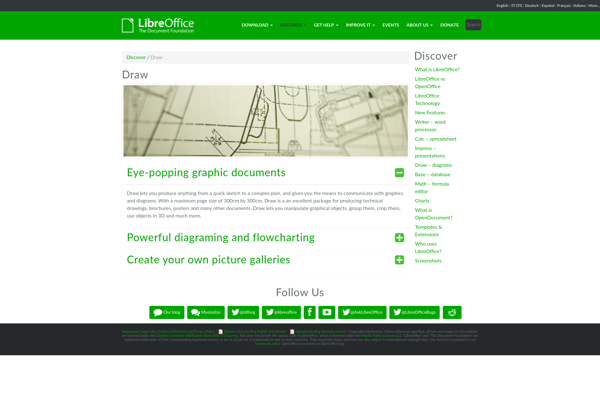
LibreOffice Draw is a vector graphics editor included in the open source LibreOffice software suite. It allows users to create a wide variety of graphical images including diagrams, flowcharts, organizational charts, network layouts, floor plans, and more.As an open source alternative to Microsoft Visio, LibreOffice Draw provides many similar features...
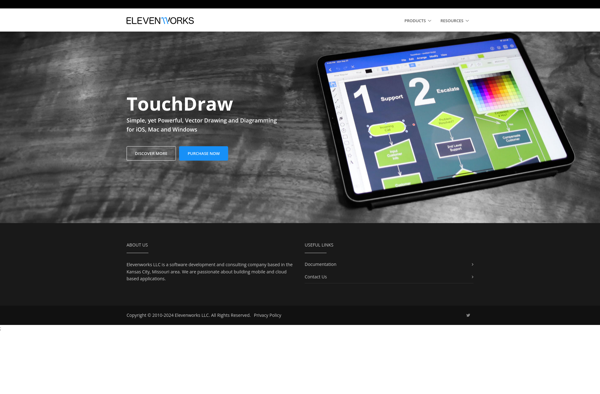
TouchDraw is a vector graphics and diagramming app made specifically for touchscreen devices like iPads, Android tablets, and Windows touchscreen PCs. It provides an intuitive touch-based interface for creating all kinds of graphics and diagrams on the go.Some key features of TouchDraw include:Vector drawing tools like paths, shapes, text, connectors...
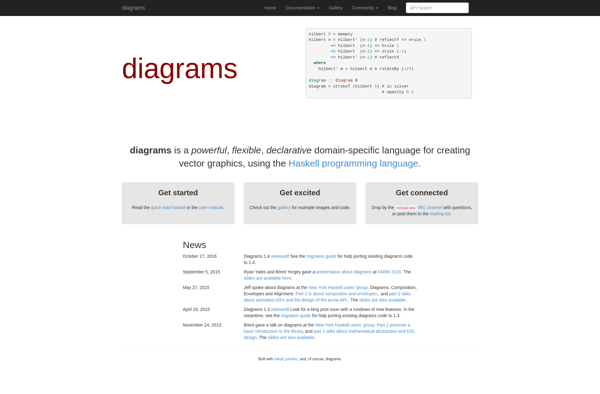
diagrams is a powerful yet easy-to-use diagramming and visualization software. With an intuitive drag-and-drop interface, diagrams allows users to quickly create flowcharts, UML diagrams, network diagrams, mind maps, wireframes, and more.Some key features of diagrams include:Intuitive drag-and-drop interface for quick diagram buildingLarge library of templates and shapesReal-time collaboration allowing multiple...
MagicDraw is a visual architecture and modeling tool used by software developers, systems engineers, and business analysts to model application structure, behavior, and business processes. It supports various standard modeling notations including UML, SysML, BPMN, and more.MagicDraw provides an intuitive graphical interface to create various diagrams like use case diagrams,...
2c8 Modeling Tool is an open-source, multi-paradigm modeling and diagramming application. It allows users to create various types of diagrams such as entity relationship diagrams, flowcharts, mind maps, organization charts, wireframes and more using a simple and intuitive graphical user interface.Some key features of 2c8 Modeling Tool include:Supports multiple diagram...
Workflow Designer is a visual workflow automation and business process management software. It provides an intuitive drag-and-drop interface for designing workflows and processes without coding.Key features include:Visual workflow designer with drag-and-drop building blocks for rapid automationConnectors for apps like Salesforce, Office 365, Box, Dropbox etc.Options for human-based tasks and approvals...
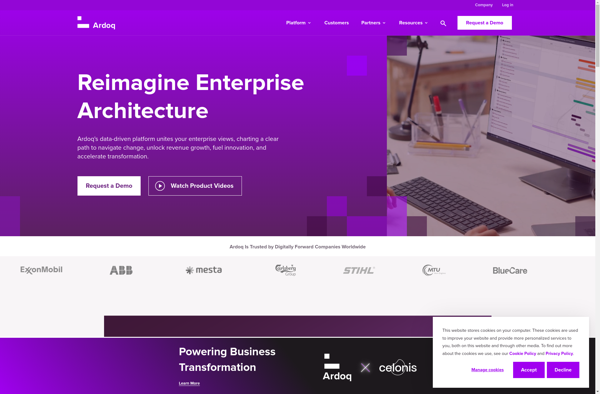
Ardoq is a software platform used by large enterprises to visualize, analyze and document their complex organizational landscapes, including business capabilities, processes, applications, data and technology infrastructure. Some key features of Ardoq:Interactive visualization canvas allowing users to create color-coded maps of their architectures, org structures, IT systems etc.Pre-configured templates and...
Cubetto is an innovative wooden programming robot that teaches the fundamentals of computer programming to young children ages 3 and up. It was created by Primo Toys in Italy as an open-ended Montessori-inspired toy to introduce coding concepts without the need for screens.At the heart of Cubetto is a smiling...
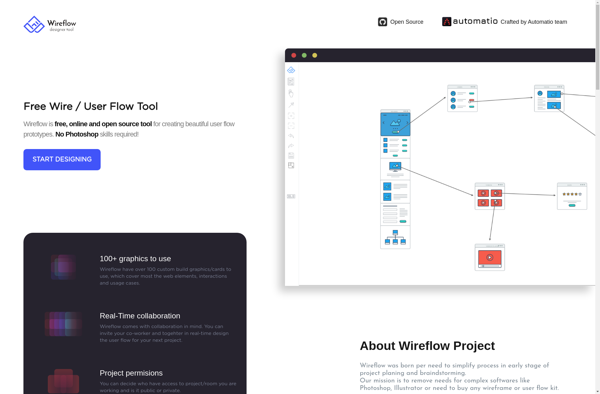
Wireflow is a web-based wireframing and mockup tool used to create prototypes and specs for website and app designs. It provides an intuitive drag and drop editor that allows designers and developers to quickly layout pages and interfaces before development begins.With Wireflow, you can easily add common UI elements like...
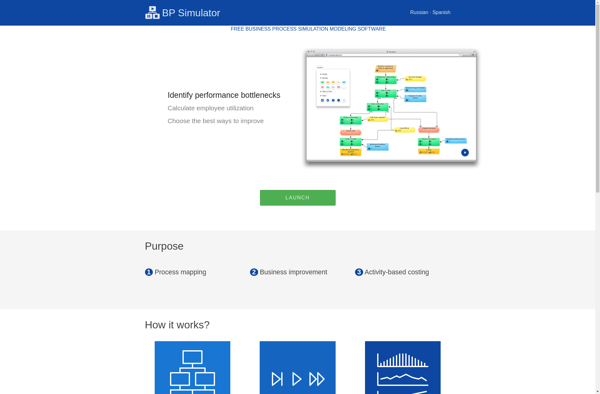
BP Simulator is an open-source web-based business process simulation software designed to help model, simulate, analyze, and optimize business processes. Some key features include:Intuitive drag-and-drop interface to model business process workflowsSupport for BPMN 2.0 standard for process modelingBuilt-in simulation engine to run experiments on process modelsAnalysis and reporting of key...
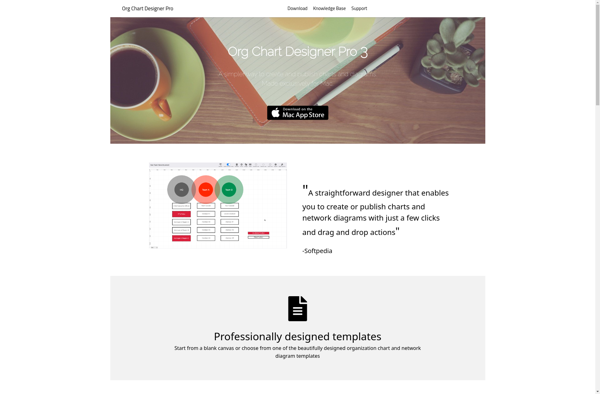
Org Chart Designer Pro is comprehensive software for designing visual organizational charts for companies and teams. With an intuitive drag-and-drop interface, users can create professional org charts in just minutes without any prior experience.Key features include:Drag-and-drop org chart creator with ready-made chart templatesOrg chart types like hierarchy, matrix, flat, photo,...
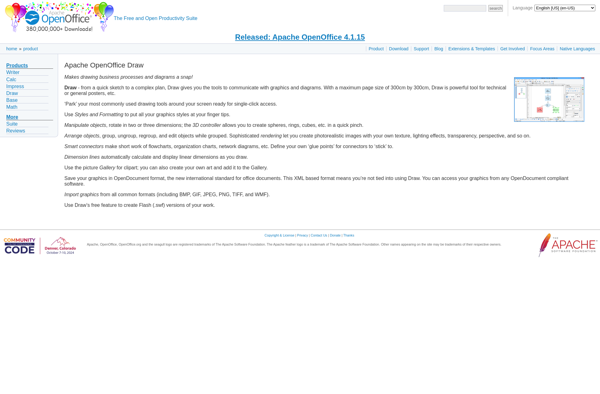
Apache OpenOffice Draw is a vector graphics editor and diagramming tool included as part of the free and open source office suite Apache OpenOffice. It has a similar user interface and feature set to Microsoft Powerpoint, providing tools to create rich graphical content such as illustrations, diagrams, charts, graphs, flowcharts,...
my.origramy is an online creative writing application designed to help authors organize and develop ideas for long-form fiction projects like novels and screenplays. The software provides a suite of tools specifically focused on the planning stages of writing a book or script.Key features of my.origramy include:- Character builders to create...
Venny is a free online Venn diagram maker used to visually compare data sets. It allows users to easily create Venn diagrams with 2 or 3 overlapping circles and add text labels in the appropriate areas of overlap between the circles.Some key features of Venny include:Intuitive drag-and-drop interface to add...
QPR ProcessGuide Xpress is a business process management and modeling software application developed by QPR Software. It provides a suite of tools for documenting, analyzing, improving, and managing business processes within an organization.With QPR ProcessGuide Xpress, users can create detailed process maps and flowcharts to visualize end-to-end workflows, activities, decision...
Oqto Diagram is a free and open-source vector graphics editor designed specifically for drawing diagrams of various kinds. It is available for Windows, Mac, and Linux.Some of the key features of Oqto Diagram include:Intuitive drag and drop interface to quickly create flowcharts, UML diagrams, workflows, mind maps, network diagrams, and...
DroidDia is an open-source diagramming and prototyping application designed for Android devices. It provides users with the tools to create a variety of diagrams and charts such as flowcharts, UML diagrams, mockups, mind maps, and more directly on their phones or tablets.Some key features of DroidDia include:Intuitive and easy-to-use interfaceDrag-and-drop...
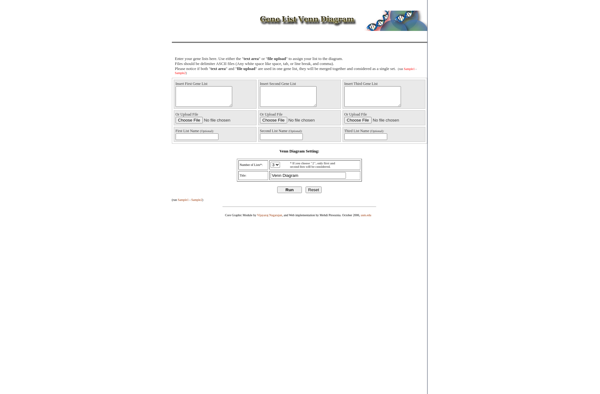
GeneVenn is a free web-based application that generates Venn diagrams to visualize comparisons between gene/transcript lists or datasets. It allows users to easily upload lists of genes or transcripts and create customizable 2-way or 3-way Venn diagrams showing the overlaps and intersections between the datasets.Some key features of GeneVenn include:Supports...
ModelFoundry is an open-source machine learning operations (MLOps) platform for the full lifecycle management of AI models. It provides a unified interface to develop, train, deploy, and monitor models across various frameworks like PyTorch, TensorFlow, and scikit-learn.Key capabilities and benefits of ModelFoundry include:Model Registry - Store, version, and track all...