Oqto Diagram
Oqto Diagram is a free cross-platform vector graphics editor for drawing diagrams and flowcharts. It has a simple and intuitive interface with a drag-and-drop functionality to quickly create flowcharts, UML diagrams, workflows, mind maps, network diagrams, and other types of grap
Oqto Diagram: Free Cross-Platform Vector Graphics Editor
A free and intuitive diagramming tool for creating flowcharts, UML diagrams, workflows, mind maps, network diagrams, and more.
What is Oqto Diagram?
Oqto Diagram is a free and open-source vector graphics editor designed specifically for drawing diagrams of various kinds. It is available for Windows, Mac, and Linux.
Some of the key features of Oqto Diagram include:
- Intuitive drag and drop interface to quickly create flowcharts, UML diagrams, workflows, mind maps, network diagrams, and more
- Large collection of styled shapes and symbols for diagrams
- Dynamic connectors between shapes with auto-routing and auto-alignment
- Flexible styling options for shapes including colors, line styles, fill effects, and more
- Real-time collaboration allowing multiple users to edit diagrams simultaneously
- Import and export diagrams in various formats like PDF, PNG, JPEG, SVG, etc.
- Customizable templates to get you started quickly
- Supports creating very large diagrams that can be exported over multiple pages
As an open-source tool, Oqto Diagram is free to use with no restrictions or paid tiers. It aims to provide an accessible and capable diagramming solution for teams and individuals with its simplicity and wide format support.
Oqto Diagram Features
Features
- Drag-and-drop interface
- Cross-platform - Windows, Mac, Linux
- Create flowcharts, UML diagrams, workflows, mind maps, network diagrams
- Vector graphics editor
- Customizable shapes and symbols
- Export to PNG, JPG, SVG, PDF formats
Pricing
- Free
- Open Source
Pros
Free and open source
Simple and intuitive to use
Good for basic diagramming needs
Active community support
Cons
Limited features compared to paid alternatives
Lacks advanced diagramming capabilities
No cloud collaboration features
Only supports basic export formats
Reviews & Ratings
Login to ReviewThe Best Oqto Diagram Alternatives
View all Oqto Diagram alternatives with detailed comparison →
Top Office & Productivity and Diagramming and other similar apps like Oqto Diagram
Here are some alternatives to Oqto Diagram:
Suggest an alternative ❐Microsoft Office Visio
Microsoft Office Visio is diagramming and vector graphics software developed by Microsoft. It is used to create a wide variety of business diagrams and visualizations including flowcharts, organizational charts, network diagrams, workflows, floorplans, and more.Key features of Visio include:Hundreds of professionally-designed templates for quick diagram creationIntuitive drag-and-drop interface to easily...
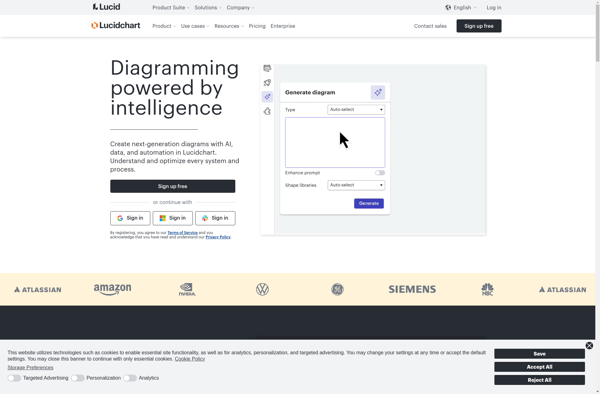
Lucidchart
Lucidchart is a cloud-based diagramming application that allows users to collaborate and share diagrams in real time. It is used by over 30 million users and integrates with popular applications like Google Workspace, Microsoft Office 365, Confluence, and Jira.With an intuitive drag-and-drop interface, Lucidchart makes it easy for anyone to...
SmartDraw
SmartDraw is a leading diagramming and visualization software used by over 1 million professionals and businesses. It provides an intuitive drag-and-drop interface to easily create over 70 types of diagrams like flowcharts, organizational charts, mind maps, project charts, floor plans, and more.SmartDraw stands out for its powerful automatic formatting and...
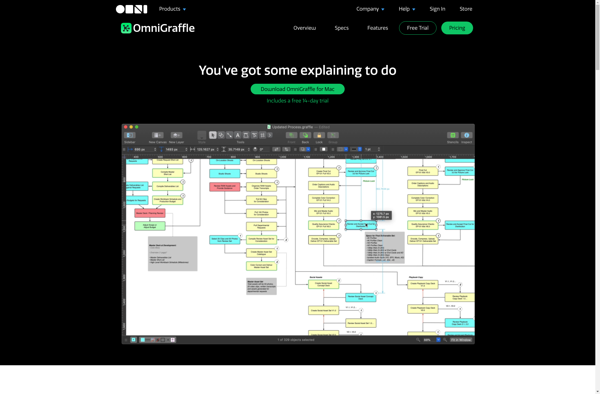
OmniGraffle
OmniGraffle is a powerful, versatile diagramming application developed by The Omni Group for macOS and iOS. First released in 2001, OmniGraffle enables users to create a wide range of diagrams, charts, illustrations, and graphic documents.With an intuitive and flexible interface, OmniGraffle makes it easy to quickly map out concepts, ideas,...
PlantUML
PlantUML is an open-source tool used for rapidly creating UML diagrams from a plain text language. It supports all standard UML diagrams like use case diagrams, component diagrams, class diagrams, sequence diagrams, state diagrams, activity diagrams, etc. The main goal of PlantUML is to provide a simple and efficient way...
Google Drawings
Google Drawings is a free online diagramming and charting tool offered by Google as part of its Google Workspace productivity suite. It allows users to create flowcharts, organizational charts, mind maps, concept maps, site maps, and other types of diagrams.Some key features of Google Drawings include:Intuitive drag-and-drop interface for easily...
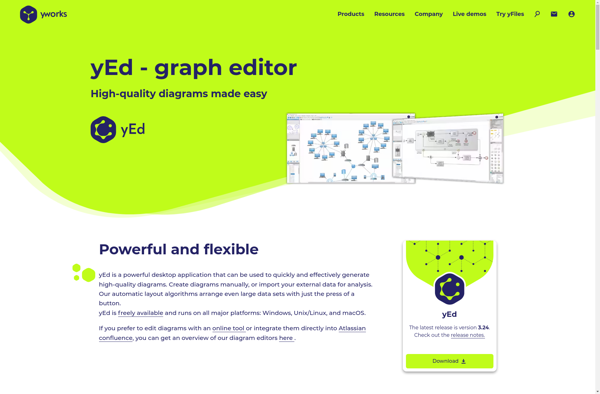
YEd Graph Editor
yEd Graph Editor is a free, powerful desktop application for Windows, macOS and Linux that can be used to quickly and easily create diagrams. It supports a wide range of diagram types including flowcharts, network diagrams, UML diagrams, BPMN diagrams, mind maps, organization charts, and more.Some key features of yEd...
Penpot
Penpot is a versatile open source design and prototyping tool built specifically for UI and UX designers. It combines design capabilities like vectors, symbols, and canvas grids with prototyping features for interaction flows, animations, and component libraries to make it easy to create beautiful designs and hi-fidelity prototypes. Some of...
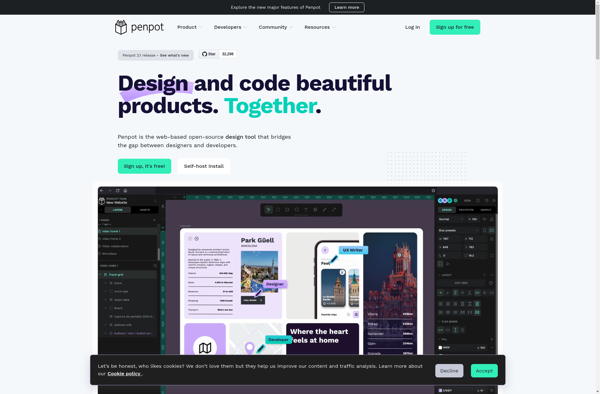
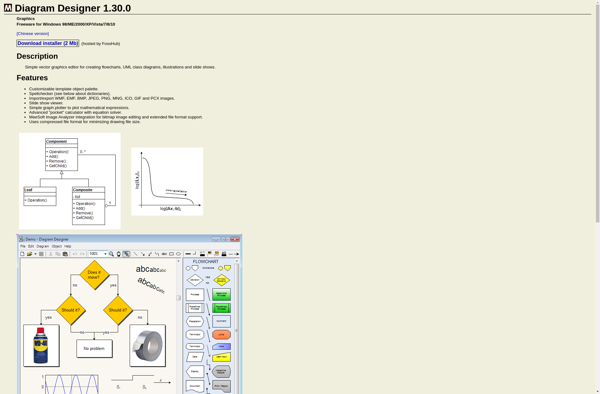
Diagram Designer
Diagram Designer is a feature-rich, free, open-source diagramming and vector graphics application for Windows, Mac and Linux. It can be used to create a variety of diagrams like flowcharts, UML diagrams, BPMN, network diagrams, wireframes, maps, floor plans and more.It has an easy-to-use drag and drop interface allowing you to...
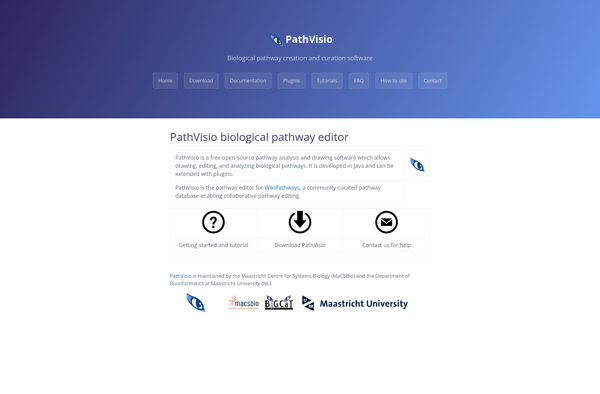
PathVisio
PathVisio is an open-source software tool for drawing, editing, analyzing, and publishing biological pathways. It is developed by the PathVisio development team at the University of Maastricht in the Netherlands.Key features of PathVisio include:Intuitive drawing tools to create pathway diagramsSupport for importing pathways from databases like WikiPathways and KEGGData visualization...
PlantText
PlantText is an artificial intelligence-powered writing assistant software that helps users generate and expand on content ideas. It utilizes advanced natural language processing to understand text and provide useful writing suggestions.Some key features of PlantText include:Summarization - It can review documents or articles and provide concise summaries.Idea expansion - Users...
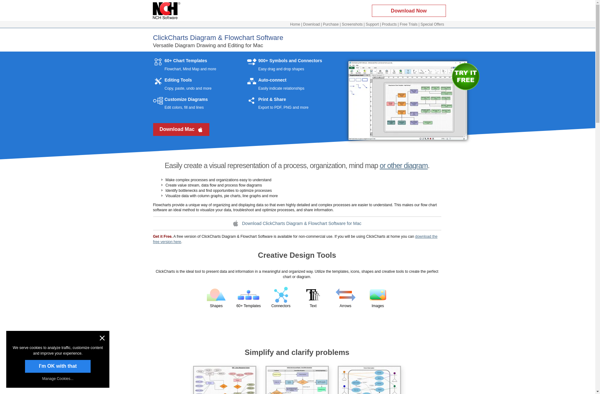
ClickCharts
ClickCharts is a business intelligence and data visualization software used to create dashboards, charts, and graphs to gain meaningful insights from data. Some key features of ClickCharts include:Drag and drop interface to easily build interactive visualizations like charts, graphs, gauges, maps, and moreLarge library of chart types including bar, pie,...