GeneVenn is a free web-based tool for visualizing the overlap and intersections between gene/transcript lists. It creates customizable Venn diagrams to show shared and unique genes between datasets. Useful for transcriptomic and genomic data analysis.
GeneVenn is a free web-based tool for visualizing the overlap and intersections between gene/transcript lists. It creates customizable Venn diagrams to show shared and unique genes between datasets. Useful for transcriptomic and genomic data analysis.
What is GeneVenn?
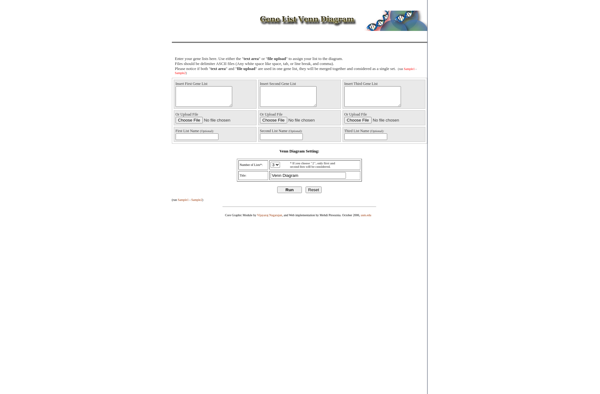
GeneVenn is a free web-based application that generates Venn diagrams to visualize comparisons between gene/transcript lists or datasets. It allows users to easily upload lists of genes or transcripts and create customizable 2-way or 3-way Venn diagrams showing the overlaps and intersections between the datasets.
Some key features of GeneVenn include:
Supports upload of gene/transcript IDs from common model organisms like human, mouse, rat, etc.
Options to customize colors, labels, and appearance of the Venn diagrams
Displays counts of shared and unique genes/transcripts between datasets
Performs statistical analysis like hypergeometric testing
As a web tool, GeneVenn does not require any downloads or installation and has an intuitive graphical interface. It is useful for genomic and transcriptomic data analysis projects needing to identify common and distinct gene sets between experimental comparisons, genetic backgrounds, treatments conditions, and more. The Venn visualization and statistical outputs make interpreting such complex comparisons much easier. Overall, GeneVenn simplifies the process of comparing gene lists and visualizing intersections across datasets.
GeneVenn Features
Features
Creates Venn diagrams to visualize shared and unique genes between datasets
Supports up to 6 datasets for comparison
Customizable diagram colors and labels
Can upload gene lists or enter genes manually
Venn diagrams are downloadable as PNG images
Links to external databases (Entrez, Ensembl, etc) for more gene info
Has advanced options like case-sensitive gene name matching
Pricing
Free
Pros
Free to use
Simple and intuitive interface
No login required
Fast generation of Venn diagrams
High-quality downloadable image output
Useful for quick genomic data analysis and visualization
Microsoft Office Visio is diagramming and vector graphics software developed by Microsoft. It is used to create a wide variety of business diagrams and visualizations including flowcharts, organizational charts, network diagrams, workflows, floorplans, and more.Key features of Visio include:Hundreds of professionally-designed templates for quick diagram creationIntuitive drag-and-drop interface to easily...
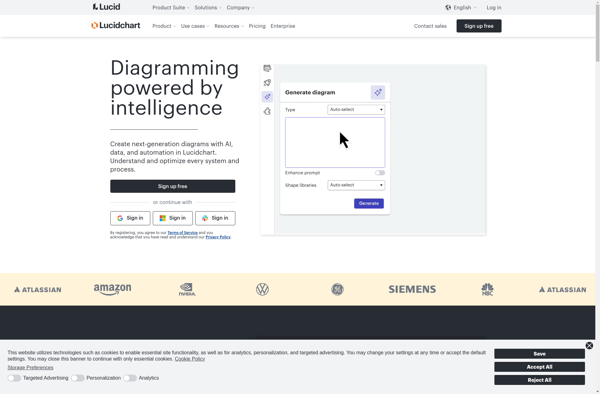
Lucidchart is a cloud-based diagramming application that allows users to collaborate and share diagrams in real time. It is used by over 30 million users and integrates with popular applications like Google Workspace, Microsoft Office 365, Confluence, and Jira.With an intuitive drag-and-drop interface, Lucidchart makes it easy for anyone to...
Google Drawings is a free online diagramming and charting tool offered by Google as part of its Google Workspace productivity suite. It allows users to create flowcharts, organizational charts, mind maps, concept maps, site maps, and other types of diagrams.Some key features of Google Drawings include:Intuitive drag-and-drop interface for easily...
Gliffy is an online diagram and flowchart creation tool that allows users to easily visualize ideas, concepts, systems, and processes. With an intuitive drag-and-drop interface and a large library of templates, examples, and symbols, Gliffy makes it simple to create flowcharts, network diagrams, UML diagrams, floor plans, user interface designs,...
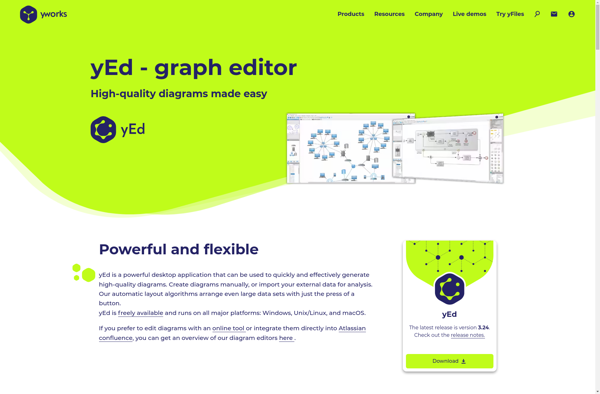
yEd Graph Editor is a free, powerful desktop application for Windows, macOS and Linux that can be used to quickly and easily create diagrams. It supports a wide range of diagram types including flowcharts, network diagrams, UML diagrams, BPMN diagrams, mind maps, organization charts, and more.Some key features of yEd...
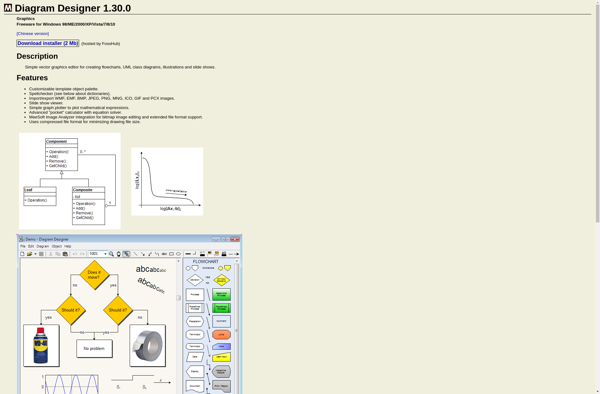
Diagram Designer is a feature-rich, free, open-source diagramming and vector graphics application for Windows, Mac and Linux. It can be used to create a variety of diagrams like flowcharts, UML diagrams, BPMN, network diagrams, wireframes, maps, floor plans and more.It has an easy-to-use drag and drop interface allowing you to...
PathVisio is an open-source software tool for drawing, editing, analyzing, and publishing biological pathways. It is developed by the PathVisio development team at the University of Maastricht in the Netherlands.Key features of PathVisio include:Intuitive drawing tools to create pathway diagramsSupport for importing pathways from databases like WikiPathways and KEGGData visualization...
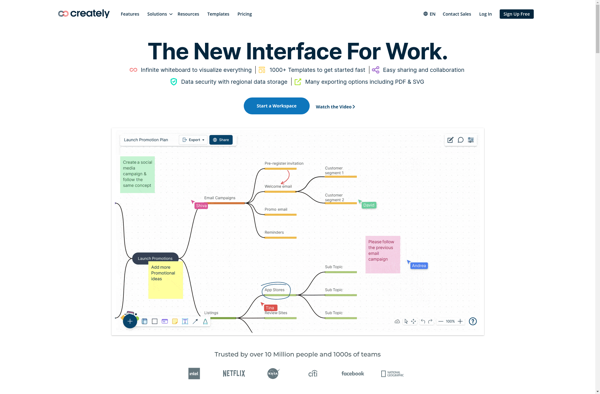
Creately is an online diagramming and visualization software used by teams for brainstorming, planning, and executing ideas. It allows users to create flowcharts, org charts, mind maps, UML diagrams, wireframes, and more using simple drag-and-drop tools.Some key features of Creately include:Intuitive interface - Easy to use drag-and-drop editor to quickly...
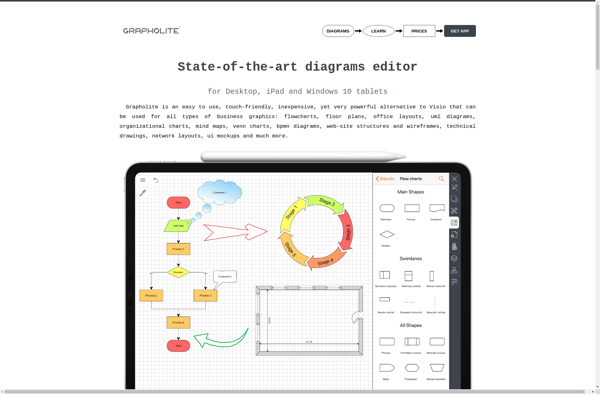
Grapholite is an open-source, cross-platform diagramming and vector graphics application. It allows users to easily create a wide variety of diagrams and charts such as flowcharts, UML diagrams, network diagrams, graphs, organizational charts, and more.Some of the key features of Grapholite include:Intuitive and easy-to-use interface for creating different types of...
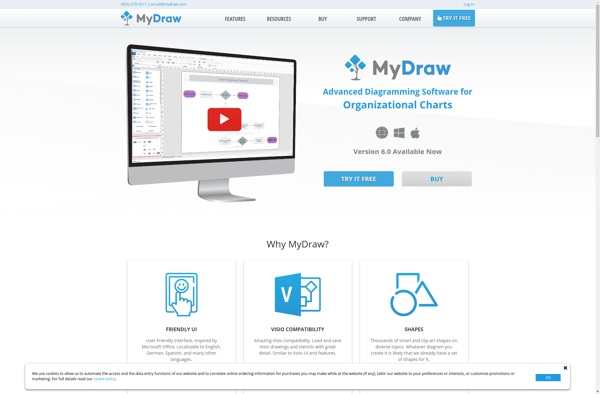
MyDraw is a free, open-source vector graphics editor available for Windows, Mac and Linux operating systems. It provides a complete set of vector drawing tools that allow users of all skill levels to create stunning 2D illustrations, diagrams, charts, logos and more.Although MyDraw is free software, its features and capabilities...
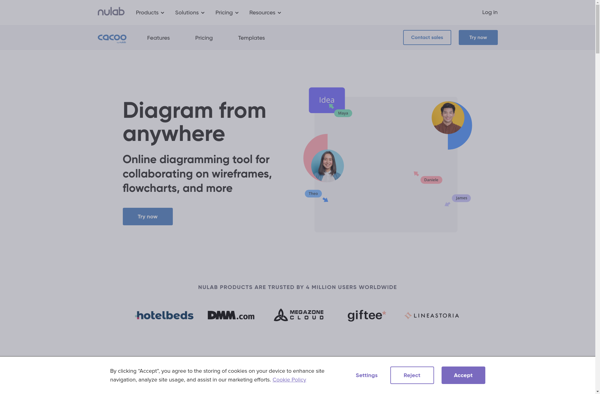
Cacoo is an intuitive and flexible online diagramming tool used by teams worldwide. It enables users to visually collaborate and communicate complex information and processes through flowcharts, wireframes, UML diagrams, network topology maps, and more.Some key features of Cacoo include:Drag-and-drop interface that makes diagramming intuitiveLarge library of templates and shapesReal-time...
Venny is a free online Venn diagram maker used to visually compare data sets. It allows users to easily create Venn diagrams with 2 or 3 overlapping circles and add text labels in the appropriate areas of overlap between the circles.Some key features of Venny include:Intuitive drag-and-drop interface to add...