Creately is an online diagramming and visualization software used for creating flowcharts, mind maps, wireframes, UML diagrams, and more. It has a simple and intuitive drag-and-drop interface with various templates and shapes.
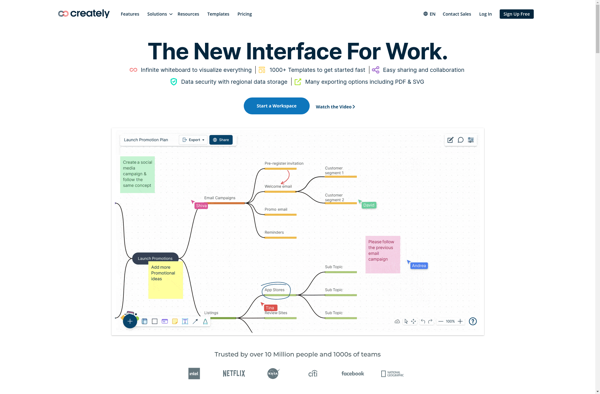
Creately: Online Diagramming and Visualization Software
Create flowcharts, mind maps, wireframes, UML diagrams, and more with Creately's intuitive drag-and-drop interface and various templates and shapes.
What is Creately?
Creately is an online diagramming and visualization software used by teams for brainstorming, planning, and executing ideas. It allows users to create flowcharts, org charts, mind maps, UML diagrams, wireframes, and more using simple drag-and-drop tools.
Some key features of Creately include:
Intuitive interface - Easy to use drag-and-drop editor to quickly create and edit diagrams.
Numerous templates - Many pre-made diagram templates to choose from to get started faster.
2000+ diagram shapes - Various shapes and icons to visually represent ideas.
Real-time collaboration - Allows multiple people to co-edit diagrams together in real-time.
Import & export - Ability to import from Lucidchart and export as PNG, JPEG, PDF and other formats.
Secured access & version control - Manage permissions and track changes with revision history.
Third party integrations - Integrates seamlessly with applications like Confluence, JIRA, Google Drive.
With an affordable pricing model, Creately is trusted by teams across various industries like technology, marketing, business consulting and education. It's ease of use along with advanced features make Creately a compelling alternative for those looking to create diagrams and charts.
Microsoft Office Visio is diagramming and vector graphics software developed by Microsoft. It is used to create a wide variety of business diagrams and visualizations including flowcharts, organizational charts, network diagrams, workflows, floorplans, and more.Key features of Visio include:Hundreds of professionally-designed templates for quick diagram creationIntuitive drag-and-drop interface to easily...
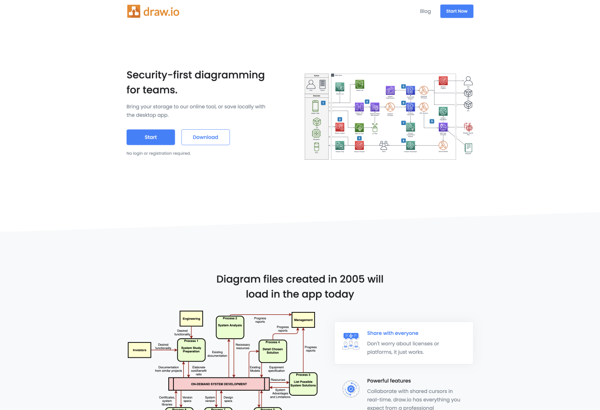
draw.io is a feature-rich diagramming and flowchart software that runs in your web browser. As a freemium tool, draw.io offers a free basic version as well as paid plans with more functionality for professionals and teams.With an intuitive drag-and-drop interface and built-in shape libraries, draw.io makes it easy for anyone...
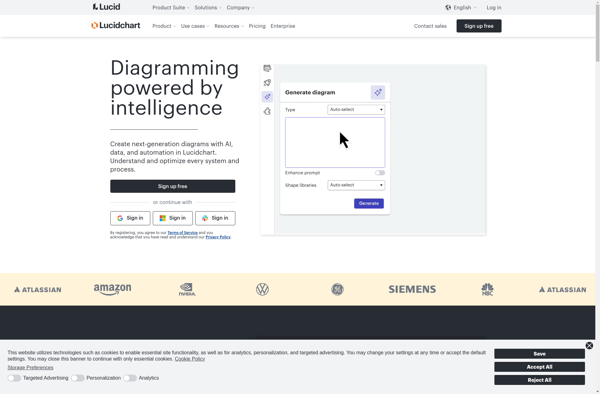
Lucidchart is a cloud-based diagramming application that allows users to collaborate and share diagrams in real time. It is used by over 30 million users and integrates with popular applications like Google Workspace, Microsoft Office 365, Confluence, and Jira.With an intuitive drag-and-drop interface, Lucidchart makes it easy for anyone to...
Flowgorithm is a free software application designed to teach the fundamentals of programming logic and algorithms. It uses flowcharts and pseudocode to allow users to visualize the structure and flow of an algorithm before converting it into actual code.Some key features of Flowgorithm include:Drag-and-drop interface to create flowcharts showing the...
Wondershare EdrawMax is a comprehensive vector diagramming software suitable for business, education, and personal use. It provides abundant templates and symbols for flowcharts, org charts, mind maps, network diagrams, floor plans, fashion designs, UML diagrams, publish maps, infographics and more. With a user-friendly interface and smart drawing and formatting tools,...
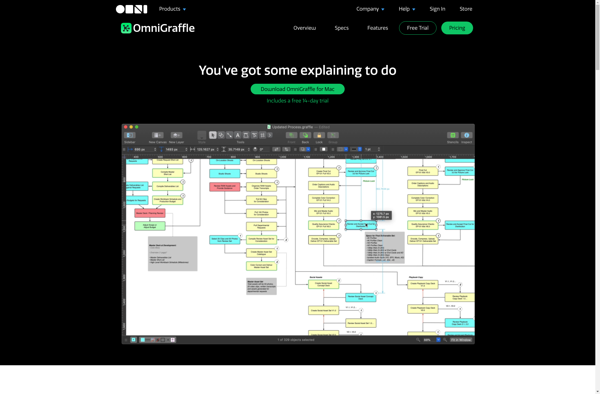
OmniGraffle is a powerful, versatile diagramming application developed by The Omni Group for macOS and iOS. First released in 2001, OmniGraffle enables users to create a wide range of diagrams, charts, illustrations, and graphic documents.With an intuitive and flexible interface, OmniGraffle makes it easy to quickly map out concepts, ideas,...
Enterprise Architect is a comprehensive visual modeling and design solution for designing and constructing software systems, business processes and enterprise architectures. It supports numerous modeling languages including UML, SysML, BPMN, ArchiMate and many more.Key features include:Intuitive graphical interface for diagramming software models, business processes, infrastructure, organizational structures and moreRobust code...
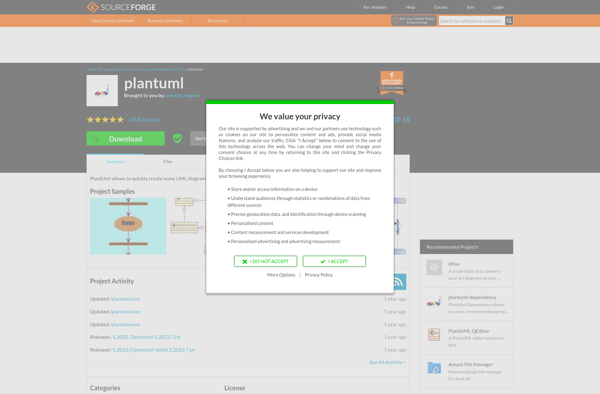
PlantUML is an open-source tool used for rapidly creating UML diagrams from a plain text language. It supports all standard UML diagrams like use case diagrams, component diagrams, class diagrams, sequence diagrams, state diagrams, activity diagrams, etc. The main goal of PlantUML is to provide a simple and efficient way...
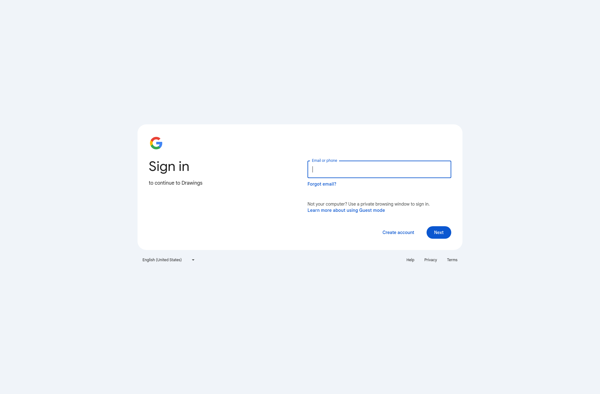
Google Drawings is a free online diagramming and charting tool offered by Google as part of its Google Workspace productivity suite. It allows users to create flowcharts, organizational charts, mind maps, concept maps, site maps, and other types of diagrams.Some key features of Google Drawings include:Intuitive drag-and-drop interface for easily...
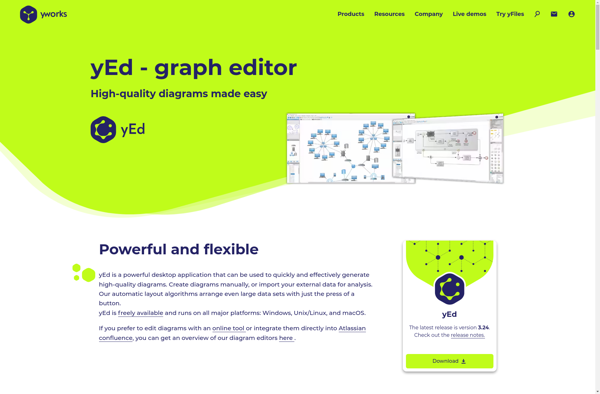
yEd Graph Editor is a free, powerful desktop application for Windows, macOS and Linux that can be used to quickly and easily create diagrams. It supports a wide range of diagram types including flowcharts, network diagrams, UML diagrams, BPMN diagrams, mind maps, organization charts, and more.Some key features of yEd...
ARIS Express is a free business process modeling and management software created by Software AG. It provides a quick and easy way for non-technical users to model, analyze and optimize business processes.With ARIS Express, you can create business process diagrams, flowcharts, org charts, risk models and more using a simple...
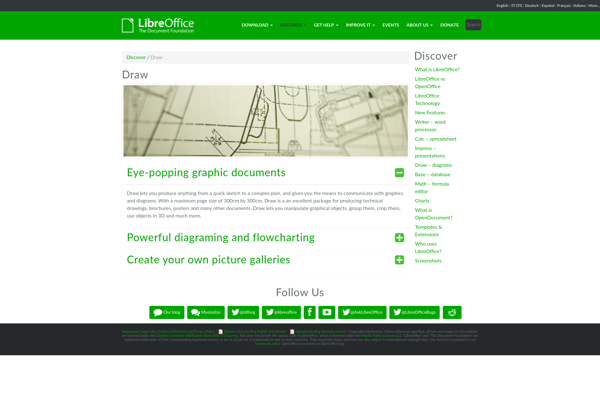
LibreOffice Draw is a vector graphics editor included in the open source LibreOffice software suite. It allows users to create a wide variety of graphical images including diagrams, flowcharts, organizational charts, network layouts, floor plans, and more.As an open source alternative to Microsoft Visio, LibreOffice Draw provides many similar features...
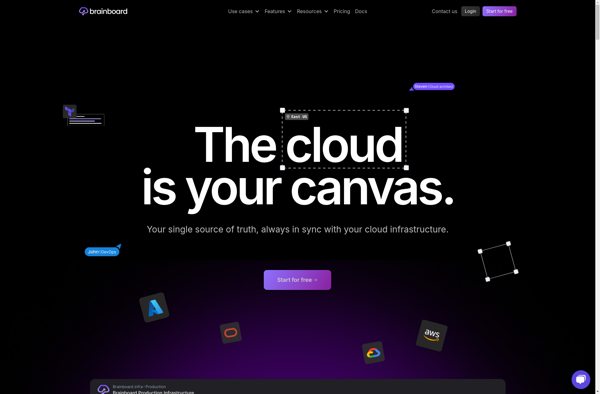
Brainboard is a digital whiteboard and visual collaboration platform designed for distributed teams. It provides a flexible infinite canvas where users can create diagrams, wireframes, mind maps, workflows and more to bring ideas to life.Some key features of Brainboard include:Real-time collaboration - Multiple people can edit the board simultaneously from...
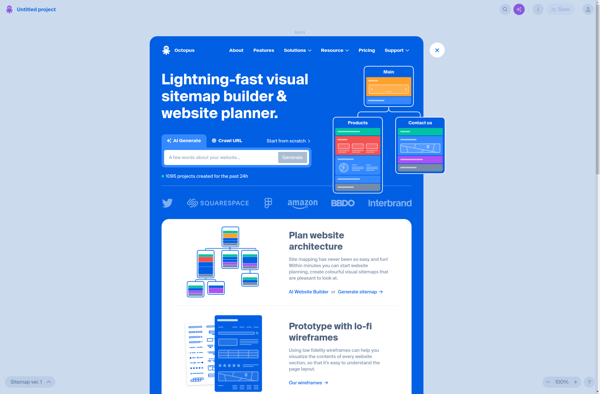
Octopus.do is a leading web-based agile project management platform designed specifically for software development teams. It provides a variety of tools to help plan, organize and track agile software projects, facilitating collaboration across distributed teams.Key features of Octopus.do include:Interactive backlogs and sprint boards to visualize and prioritize tasksCustom workflows to...
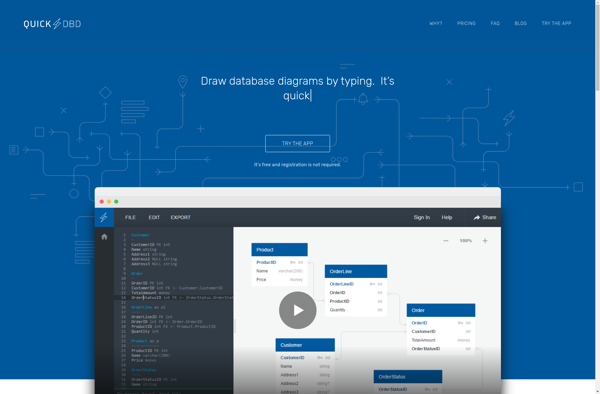
QuickDBD is a free online database diagram designer and modeling tool created by StackBy. It allows users to visually create entity relationship diagrams, conceptual data models, database schemas, flowcharts, UI mocks, and more for software and application planning and documentation.With an intuitive drag-and-drop interface, users can easily design diagrams that...
AxGlyph is a professional font editor software used for creating, editing, and customizing digital fonts. It provides a full set of advanced typography tools for precise control over each glyph, including vector drawing, Bezier curve editing, anchor and handle manipulation, path operations, layering, and more.Key features of AxGlyph include:Intuitive glyph...
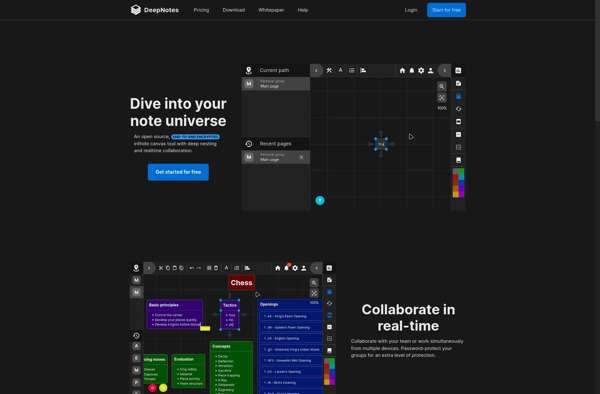
DeepNotes is a smart note-taking application powered by artificial intelligence. It provides users with multiple ways to capture ideas and thoughts including typing, handwriting recognition, speech-to-text, drawing, image capture, and more. DeepNotes organizes notes using tags, natural language processing, and knowledge graphs to enable quick retrieval later.Key features of DeepNotes...
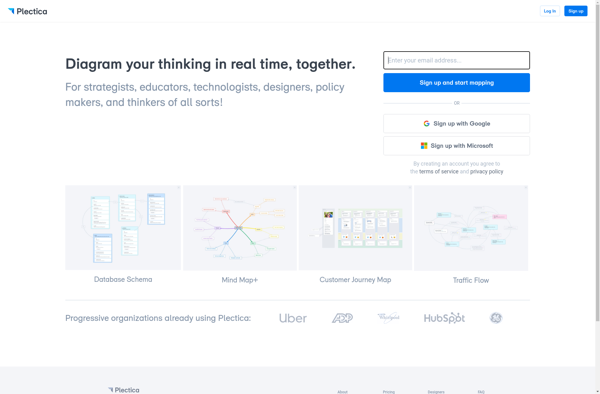
Plectica is a versatile visual mapping and modeling software designed to organize information, concepts, and ideas into logical, structured diagrams and maps. With an intuitive drag-and-drop user interface, Plectica makes it easy to link together ideas and visualize the relationships between them.Key features and uses of Plectica include:Brainstorming - Easily...
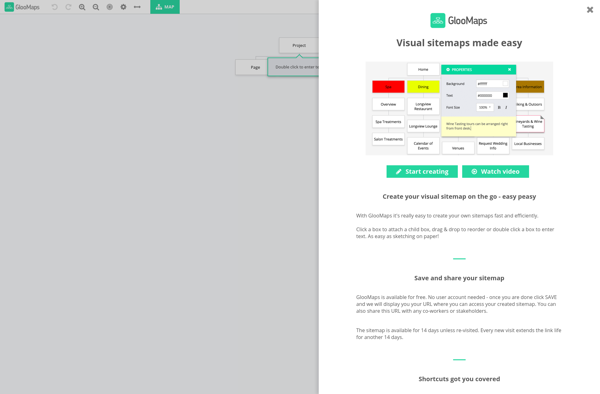
GlooMaps is a leading cloud-based mapping and location intelligence platform designed for enterprises. It allows organizations to easily collect, manage, analyze and visualize location data to gain actionable insights and improve business performance.Key capabilities and benefits of GlooMaps include:Interactive mapping with support for custom base maps, markers, lines, shapes etc.Location...
Prototype Composer is a free and open-source user interface design and prototyping tool. It allows designers and developers to quickly sketch out user interface ideas and concepts and turn them into interactive prototypes. It includes features for:Drawing vector shapes and adding imagesCreating artboards to organize layout ideasCode output of designs...
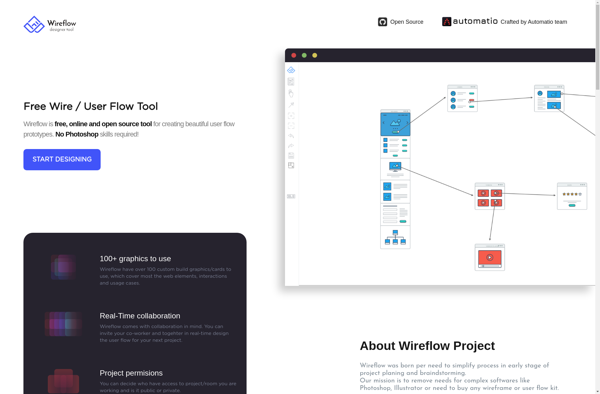
Wireflow is a web-based wireframing and mockup tool used to create prototypes and specs for website and app designs. It provides an intuitive drag and drop editor that allows designers and developers to quickly layout pages and interfaces before development begins.With Wireflow, you can easily add common UI elements like...
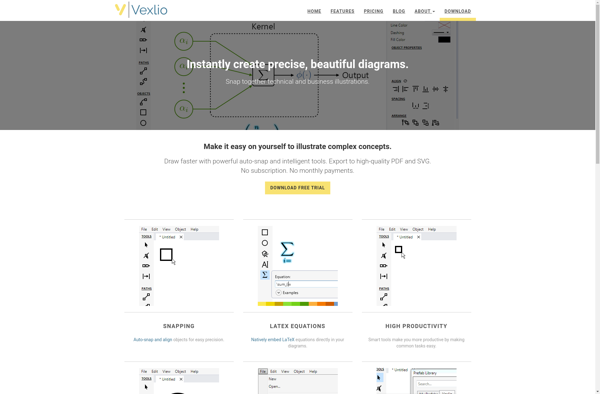
Vexlio is a feature-rich vector graphics editor used for graphic design and digital art. It enables designers, illustrators and artists to create 2D graphics such as logos, icons, flyers, brochures, infographics and more for both print and web.Some key features of Vexlio include:Intuitive and easy-to-use interfaceRobust tools for drawing vectors,...
Venny is a free online Venn diagram maker used to visually compare data sets. It allows users to easily create Venn diagrams with 2 or 3 overlapping circles and add text labels in the appropriate areas of overlap between the circles.Some key features of Venny include:Intuitive drag-and-drop interface to add...
Graphesent Anim is a feature-rich 2D animation software solution designed specifically for vector animation. It provides a complete workflow for creating stunning frame-by-frame and tween animations with an intuitive and easy-to-use interface.Key features include:Vector drawing tools for shape creation and editingOnion skinning for referencing previous framesPowerful tweening engine for automatic...
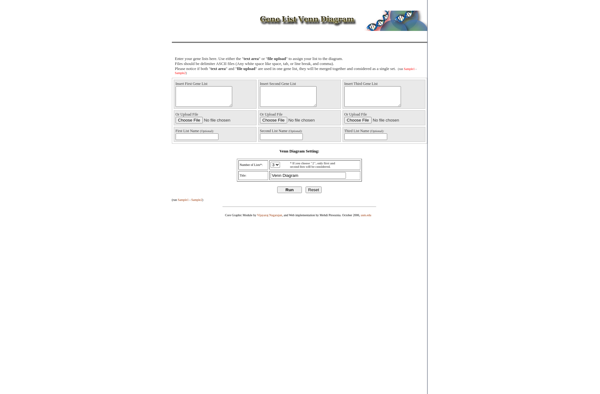
GeneVenn is a free web-based application that generates Venn diagrams to visualize comparisons between gene/transcript lists or datasets. It allows users to easily upload lists of genes or transcripts and create customizable 2-way or 3-way Venn diagrams showing the overlaps and intersections between the datasets.Some key features of GeneVenn include:Supports...
Diagramiq is a feature-rich online diagram and flowchart software that allows users to create various types of diagrams including flowcharts, UML diagrams, organizational charts, mind maps, wireframes and more. It comes with a drag-and-drop interface and pre-made templates making it easy for beginners to get started.Some key features of Diagramiq:Intuitive...
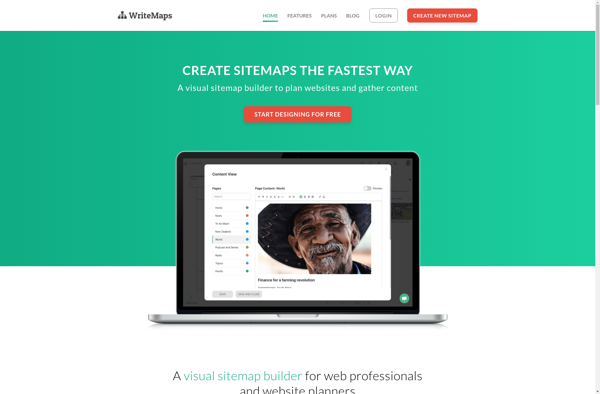
WriteMaps is an online mind mapping and brainstorming software used to visually organize ideas, concepts, and information. As a versatile thought organizing tool, WriteMaps enables users to quickly create colorful and structured diagrams to map out their thoughts.With an intuitive drag-and-drop interface, users can easily add ideas and links to...
Syngraph.me is a free online mind mapping and brainstorming application. It provides a flexible canvas for users to visually organize ideas, concepts, and information. With an intuitive drag-and-drop interface, Syngraph.me makes it easy for anyone to create colorful and dynamic maps without the need for artistic skill or design expertise.Some...
Holori is an augmented reality (AR) software that enables users to visualize 3D models in real-world environments. It provides interactive AR experiences by overlaying digital content and information onto the physical world.Some key features of Holori include:Importing and visualizing 3D models of furniture, appliances, buildings, etc. Users can walk around...
Tiggr is a cloud-based project management and team collaboration software designed for agile development teams. Its key features include:Customizable kanban boards for visualizing workflows and tracking progressFlexible task management with categories, assignments, due dates, comments etc.Customizable reports and real-time analytics for monitoring cycle times and identifying bottlenecksEasy time tracking allowing...
Iplotz is a user-friendly, online data visualization and chart creation tool. With Iplotz, anyone can easily turn datasets and tables into interactive graphs, charts, maps, and more for analysis or sharing.Some key features of Iplotz include:Intuitive drag and drop interface to upload datasets and choose chart typesSupport for a wide...