Circos
Circos: Open-Source Data Visualization Software
Circos is an open-source software used to visualize data in a circular layout, commonly used for genomic data exploration and visualization of complex datasets and networks.
What is Circos?
Circos is an open-source software originally developed for visualizing genomic data. It creates circular layouts that can display relationships between data points and illustrate complex patterns across genomes. The key features of Circos include:
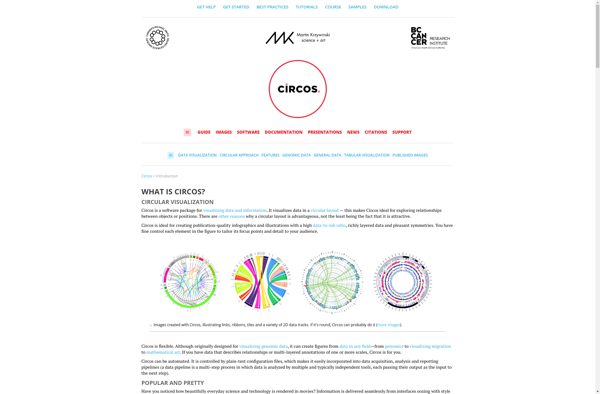
- Circular ideograms for displaying genomic coordinates and data tracks.
- Ribbons and links for connecting related data points across tracks and circular axes.
- Scatter, line and histogram plots for showing quantitative data.
- Heatmaps to represent matrices and display patterns in large data sets.
- Flexible configuration using plain text files for designing complex visualizations without programming.
- Publication-ready vector graphics output.
Circos visualizations help researchers gain insight into genomic similarities and structural variations across organisms. By arranging genomes/chromosomes around a circle and connecting related data points, Circos reveals syntenic relationships, rearrangements, conservation of genes or regulatory elements across species. It highlights variation, harmonization and concordance in the data. Circos facilitates the identification and analysis of translocations, inversions, fusions, conserved elements and more in an intuitive visualization.
Originally created for genomic data analysis, Circos has also been used for visualizing data networks in other fields like business analytics, social network analysis and more. The circular connectivity makes it easy to spot relationships in large, multidimensional data sets. Customized Circos plots can help reveal structure and patterns that are not apparent from looking at the raw data.
Circos Features
Features
- Visualizes data in a circular layout
- Can visualize connections between entities in large datasets
- Supports visualizing relationships between genomic data like DNA sequences
- Allows exploration of complex networks and relationships in data
- Highly customizable layout, colors, fonts, etc
- Can integrate with data from many formats like BED, GFF, SAM, etc
- Includes utilities for data analysis and manipulation
- Command-line and GUI versions available
Pricing
- Open Source
Pros
Cons
Official Links
Reviews & Ratings
Login to ReviewThe Best Circos Alternatives
View all Circos alternatives with detailed comparison →
Top Science & Research and Genomics Visualization and other similar apps like Circos
No alternatives found for Circos. Why not suggest an alternative?