VisualEyes is a data visualization and dashboarding software that allows users to connect to various data sources, create interactive charts and graphs, build dashboards, and share analytics through web apps or embedded into other systems. It's designed to enable business us
VisualEyes: Data Visualization and Dashboarding Software
Connect to various data sources, create interactive charts, build dashboards, and share analytics through web apps or embedded into other systems.
What is VisualEyes?
VisualEyes is a business intelligence and data visualization software used by companies to visualize data, create dashboards and analytics apps, and uncover insights for better decision making. It provides an intuitive drag-and-drop interface for building interactive charts, graphs, and dashboards connected to a wide variety of data sources.
Key features of VisualEyes include:
Flexible and interactive data visualization with support for charts like bar, line, pie, scatter, pivot tables, geographic maps, and more
Dashboard designer to build, customize, and share interactive dashboards
Guided analytics with AI-powered insights, anomaly detection, forecasting, and predictions
Governed data access controls and row-level security
APIs and embed options to access analytics through other apps
Connectors for databases, cloud apps, files, data warehouses and more
On-premises and cloud deployment options
VisualEyes empowers non-technical users to visualize and unlock insights from their business data without needing developer resources. With its user-friendly interface combined with enterprise-ready governance, scalability, and data connections, VisualEyes provides self-service analytics capabilities for companies looking to democratize data access across their organization.
VisualEyes Features
Features
Drag-and-drop interface to build dashboards
Connects to various data sources like SQL, NoSQL, REST APIs
Supports real-time data streaming
Has a library of customizable chart types and widgets
Allows collaboration through sharing of dashboards
Can embed analytics into web apps and portals
Has role-based access control and security features
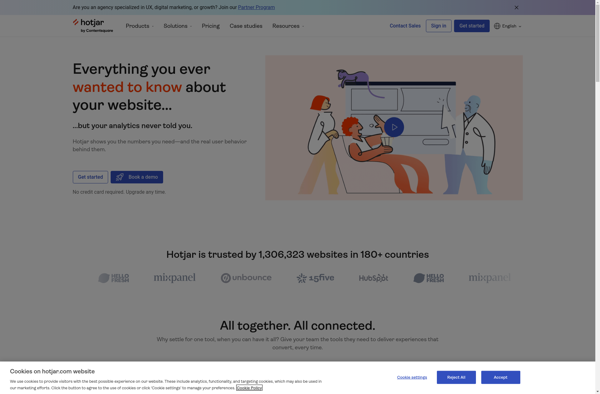
Hotjar is a powerful user experience analytics and feedback software that helps website owners understand how visitors are truly using their site. Some of the key features Hotjar provides include:Heatmaps - See where users click, tap, scroll, and focus attention on each pageRecordings - Watch individual user sessions to see...
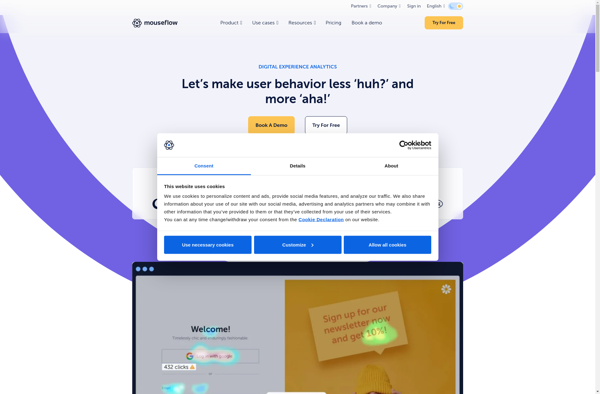
Mouseflow is a user session replay and heatmapping software that records everything visitors do on your website, allowing you to play back individual user recordings to understand behavior. It provides powerful insights into how users really interact with your site.Features include:Session recordings - Watch exactly what each visitor did on...
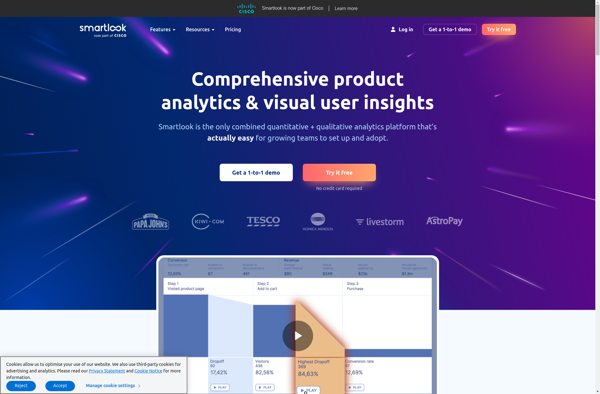
Smartlook is a user experience analytics software used to understand and improve user engagement on websites and mobile apps. It records visitors' sessions, clicks, taps, and gestures, allowing product teams to visualize customer journeys with session recordings and heatmaps.Key features of Smartlook include:Session recordings - Watch exactly how visitors use...
MouseStats is a user activity monitoring software used for usability testing and data analytics. It quietly records all mouse movements, clicks, scrolls, typing, and general interactions that a user performs on a website or application.The software generates visual heatmap reports showing hot spots and patterns of usage. It also produces...
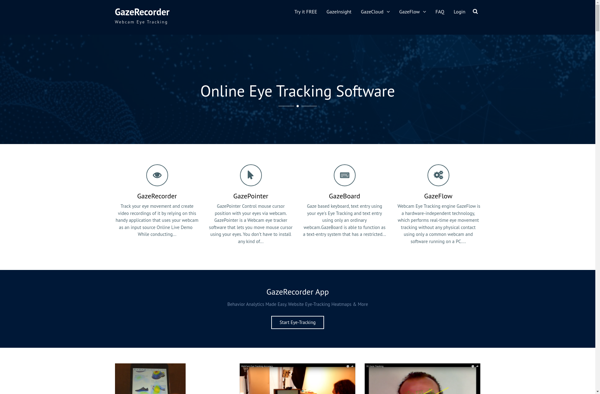
GazeRecorder is an open-source, cross-platform software application designed specifically for eye tracking research and analysis. It enables researchers, marketers, UX designers, and more to easily record webcam or dedicated eye tracker data to produce visualizations of gaze patterns and fixations.Some key features of GazeRecorder include:Works with most major eye tracking...
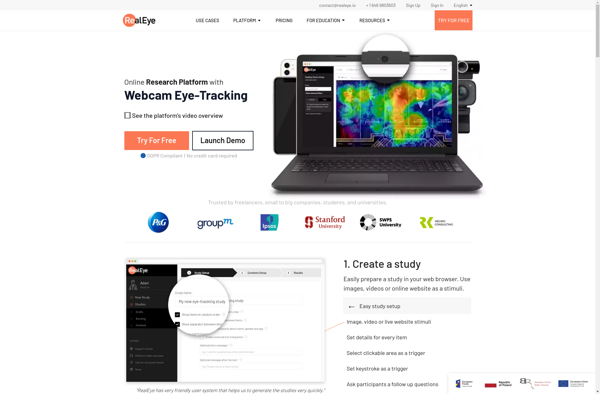
RealEye is a user research and usability testing software designed to help understand customer experiences and improve digital products. It enables product and UX teams to easily conduct remote user tests and gather qualitative and quantitative data.With RealEye, you can:Record screen and webcam videos of test participants completing tasks in...
Clickmap is a web analytics software used to visually understand how users interact with a website. It tracks user activity like clicks, mouse movements, scrolling, and generates heatmaps and session recordings to illustrate interaction patterns.Key features of Clickmap include:Heatmaps showing click data, mouse movements, and scroll reachSession recordings to see...
HeatMapCo is a user behavior analytics and heatmap software used by website owners, marketers, and analysts to understand how users interact with their website or app. The software generates visual heatmaps and click analytics showing where visitors click, tap, scroll, and focus their attention.Key features of HeatMapCo include:Scroll maps showing...