CaniVIZ is a data visualization tool for veterinarians that allows them to easily create charts and graphs from medical records data to identify trends and insights. It has preconfigured templates and integrates with major practice management systems.
CaniVIZ: Data Visualization Tool for Veterinarians
A data visualization tool designed specifically for veterinarians, CaniVIZ allows easy creation of charts and graphs from medical records data to identify trends and insights, with preconfigured templates and integration with major practice management systems.
What is CaniVIZ?
CaniVIZ is a veterinary-specific data visualization and analytics platform designed to help veterinarians and veterinary practices visualize and uncover insights from their medical records data. It allows practices to easily create interactive charts, graphs, and dashboards to track trends over time, compare metrics, and identify areas for improvement.
Some key features of CaniVIZ include:
Preconfigured templates and charts specifically for veterinary data like patient demographics, diagnosis trends, treatment outcomes, lab test utilization, etc.
Integration with major veterinary practice management software platforms like IDVet, VisionVPM, and more so data can flow automatically
An easy drag-and-drop interface to quickly build custom dashboards from scratch without any technical skills
Options to filter data by dates, locations, veterinarians, and other parameters for granular analysis
Automated alerts and notifications when certain trends are detected in the data
Role-based access controls to limit exposure of sensitive practice data
Secure cloud-based platform with 256-bit encryption
By making data visualization intuitive and seamless for veterinary professionals, CaniVIZ enables clinics to uncover data-driven insights to improve quality of care, optimize operations and workflow, boost profitability, and power data-informed decision making.
CaniVIZ Features
Features
Visualize medical records data
Create charts and graphs
Identify trends and insights
Preconfigured templates
Integrates with practice management systems
Pricing
Subscription-Based
Pros
Makes data visualization easy for vets
Allows vets to spot trends in medical records
Saves time over creating visualizations manually
Templates require no coding or design skills
Seamlessly integrates with existing systems
Cons
Limited to veterinary use case
Requires subscription for full features
May involve learning curve for less tech-savvy users
STP Viewer is a specialized software tool for network engineers and administrators to visualize and analyze the Spanning Tree Protocol (STP). It provides an intuitive graphical interface to load network packet capture files (PCAPs), inspect Bridge Protocol Data Units (BPDUs) and STP frames, study STP topology and events, identify issues...
eDrawings Viewer is a feature-rich 2D/3D CAD viewer application that allows anyone to view and print CAD models without the need for the native CAD software. It is offered free by SOLIDWORKS as a lightweight tool to share and collaborate on CAD data.eDrawings supports all major CAD formats including SOLIDWORKS,...
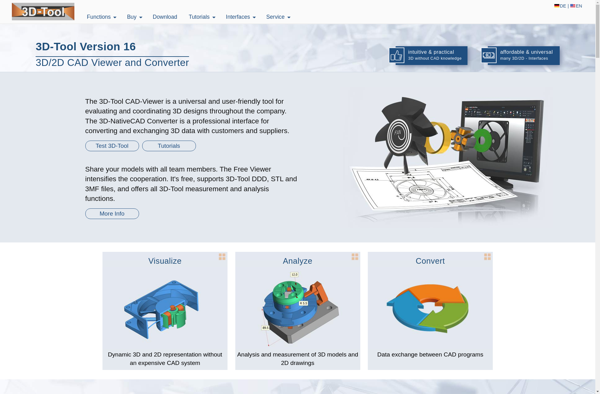
3D-Tool is a free and open-source 3D modeling and animation suite aimed at beginners. It allows users to create, edit, and view 3D models built from geometrical primitives like cubes, spheres, cylinders, cones etc. Users can combine these to create more complex polygon meshes.Some key features of 3D-Tool include:Intuitive interface...
Solid Edge Viewer is a free computer-aided design (CAD) software application developed by Siemens Digital Industries Software. It allows users to view, interrogate, and mark up 2D and 3D CAD files without requiring access to the full Solid Edge CAD software.Some key features of Solid Edge Viewer include:Supports over 25...
A360 Viewer by Autodesk is a free lightweight software application for viewing 2D and 3D files across desktop and mobile devices. It supports a wide range of popular design file formats including DWG, RVT, IFC, NWD, NX, SOLIDWORKS, CATIA, Rhino and more.Some key features of A360 Viewer include:Fast and smooth...
ENSUITE-VIEW is a versatile software tool for visual analysis of biomolecular sequence and structure data. It can read, analyze, and visualize multiple sequence alignments of proteins, DNA, and RNA to study evolutionary relationships and conservation patterns. Structural biologists can use ENSUITE-VIEW to analyze 3D protein structures from the Protein Data...
IGS Viewer is a versatile and user-friendly 3D model viewer that is available for free. Developed as an open-source project, it can display and manipulate 3D models from a variety of common file formats including STEP, IGES, STL, and more.Some key features of IGS Viewer include:Orbiting, panning, and zooming models...
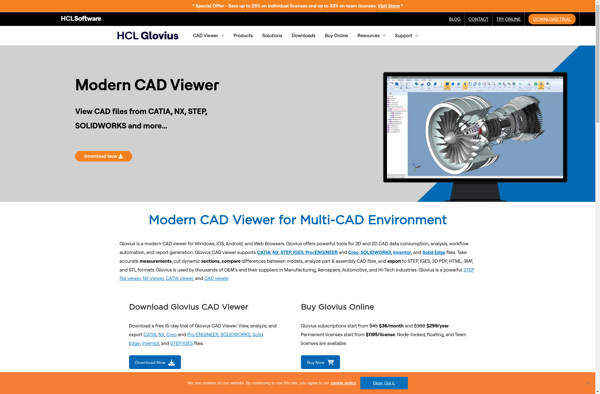
Glovius is a feature-rich screenshot capture and image annotation tool for Windows. It is open-source software distributed free of charge.With Glovius, you can take fullscreen, window or region screenshots with just a click or keyboard shortcut. It allows you to draw, add text, highlight, blur, crop, add arrows and more...
IDA-STEP Viewer is a free, open source computer-aided design (CAD) viewer application that supports visualization and investigation of STEP (STandard for the Exchange of Product model data) files. STEP is an ISO standard data format used for representing 3D mechanical CAD models for product manufacturing.Key features of IDA-STEP Viewer include:Opens...
JT2Go is a lightweight, cross-platform viewer and converter for JT files. It enables users to view and convert JT data without needing expensive CAD software or licenses.Some key features of JT2Go include:Supports both JT 8.0 and JT 10.0 formatsView JT data including PMI, metadata, assemblies, geometry, and moreConvert JT files...
CADbro is a free and open source 3D CAD modeling software for Windows. It aims to provide a simple, easy to use yet powerful CAD application that supports standard 3D modeling operations and parametric features. Some key features of CADbro include:Create and edit 2D sketchesExtrude or revolve sketches to create...
PartXplore is an open-source, parametric CAD software application designed for mechanical engineering. It enables users to create 3D models of parts and assemblies, as well as generate 2D drawings, perform dynamic simulation and analysis, do photorealistic renderings, and much more.Some of the key features of PartXplore include:Parametric modeling tools like...