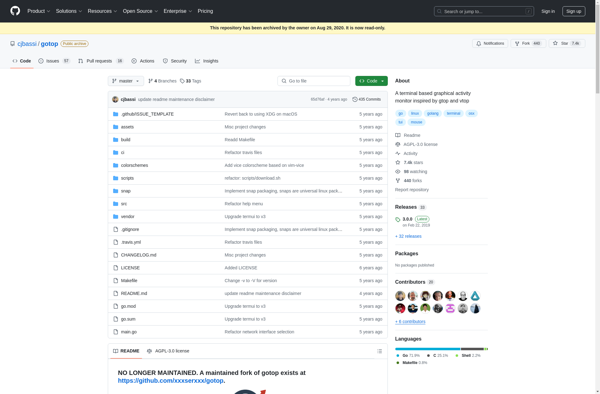
gotop is a terminal based system monitoring tool for Linux/Unix systems. It displays information about CPU usage, memory and swap usage, disk I/O, network speeds, temperatures, processes, and more in an easy-to-read format directly in the terminal.
gotop is a terminal based system monitoring tool for Linux/Unix systems. It displays information about CPU usage, memory and swap usage, disk I/O, network speeds, temperatures, processes, and more in an easy-to-read format directly in the terminal.
What is Gotop?
gotop is a terminal based system monitoring tool for Linux and Unix-like systems. It displays vital system metrics and information directly in the terminal using ASCII characters. gotop is designed to be lightweight and simple to use.
Some of the key information displayed by gotop includes:
CPU usage and frequency
Memory and swap usage
Disk usage and I/O statistics
Network speeds (upload and download)
System temperatures and fan speeds
Top processes by CPU and memory usage
gotop displays this system information in neatly formatted boxes and auto-updates the data in real-time. It allows administrators and users to easily monitor overall system performance and running processes without having to use multiple terminal tools. Some key features include the ability to sort processes by different metrics, search for processes, and highlight processes using filters.
As an open source terminal based tool, gotop provides a simple yet powerful way to monitor systems performance. It can help identify performance bottlenecks and troubleshoot issues on Linux and Unix-like systems. The resource lightweight and ASCII interface makes it well-suited for system administrators, developers, and power users.
Gotop Features
Features
Terminal-based system monitoring
Displays CPU usage, memory and swap usage, disk I/O, network speeds, temperatures, and processes
Easy-to-read format directly in the terminal
Supports Linux/Unix systems
Pricing
Open Source
Pros
Lightweight and efficient
Provides comprehensive system information at a glance
Customizable layout and display options
Open-source and free to use
Cons
Limited to command-line interface
May not provide as much detail as desktop-based monitoring tools
Requires some technical knowledge to fully utilize
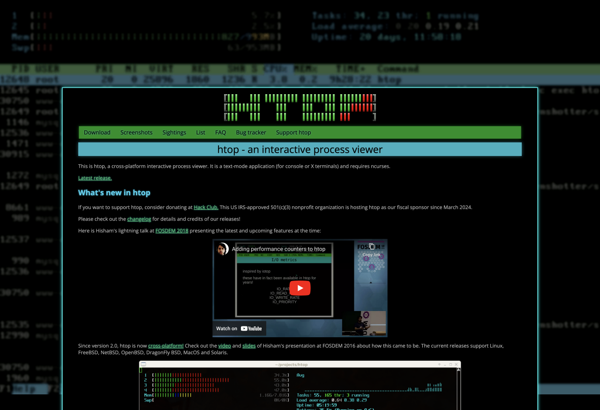
htop is an open source, cross-platform interactive process viewer for Linux systems. It aims to provide a more user-friendly interface to view and interact with running processes than the default top utility included with most Linux distributions.Some key features of htop include:Color-coded rows and columns to easily identify process states...
vtop is an open-source, cross-platform interactive monitoring tool for Linux/Unix systems. It provides a real-time view of system resources like CPU, memory, disks, network usage, and active processes. Some key features of vtop include:Real-time graphs and statistics for CPU, memory, network traffic, disk I/O, and moreInteractive terminal UI with sorting/filtering...
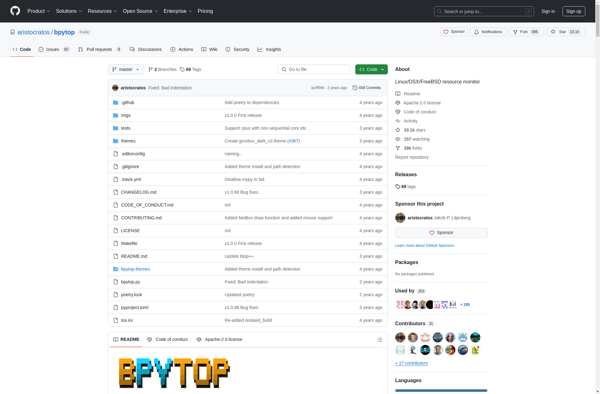
BPYTOP is an open-source system monitor and process viewer for Linux systems. It is designed as an alternative to tools like top, htop, and glances by providing both system-level statistics and process-level statistics in a visually appealing curses-based interface.Some of the key features of BPYTOP include:Detailed CPU usage statistics -...
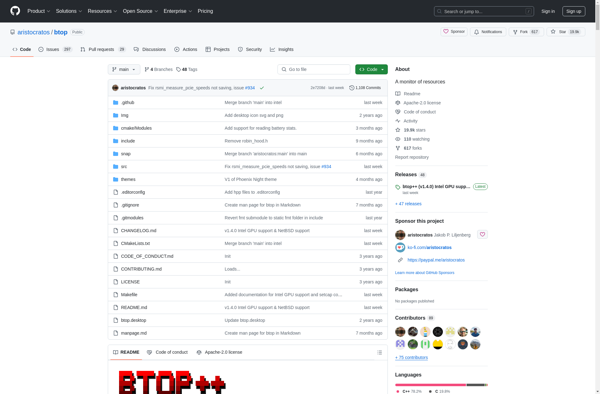
btop is a system monitoring utility for Linux systems, providing an interactive interface to monitor CPU, RAM, swap, and disk usage. It is designed to be highly customizable and provide a wealth of performance data in an easy-to-use terminal-based UI.Some key features of btop include:Real-time graphs for CPU (with core,...
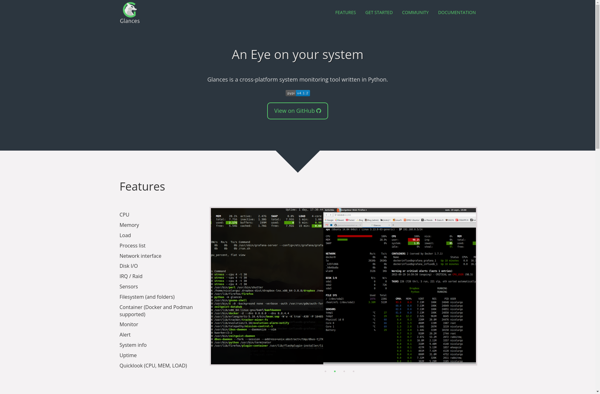
Glances is an open source, cross-platform system monitoring tool written in Python. It allows you to monitor your system's key metrics like CPU, memory, disks, network, and processes in real-time through a curses or web interface.Some key features of Glances include:Real-time overview of system resources utilizationMinimal dependencies and easy to...
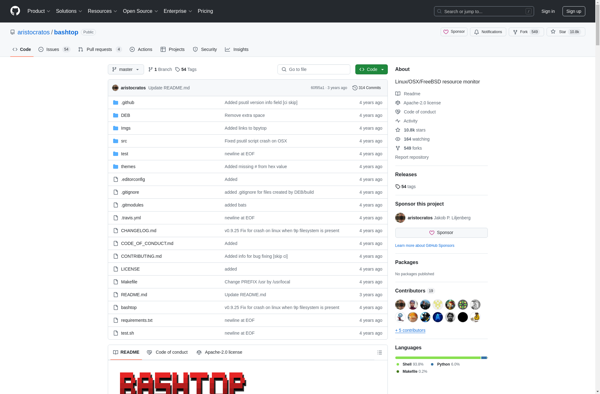
Bashtop is a text-based system monitoring tool for Linux that runs directly in the terminal. It provides detailed, real-time information on key system resources like the CPU, memory, processes, network traffic, and disks/storage.Some of the key features of Bashtop include:CPU usage statistics - individual core usage, frequency, temperatureMemory and swap...
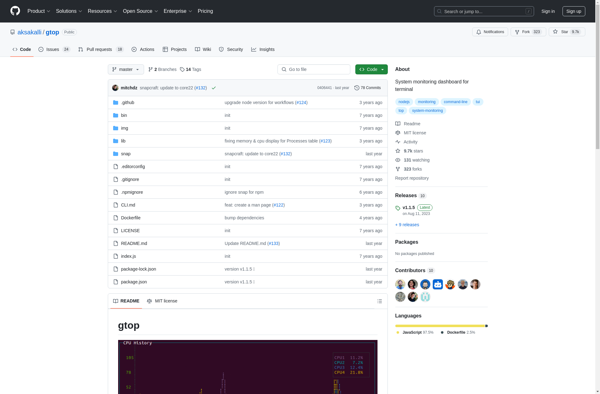
gtop is an open-source, terminal-based system monitoring utility for Linux systems. It allows users to visually track CPU and memory usage in real-time through an interactive dashboard shown directly in the terminal.Some key features of gtop include:Live graphs and statistics for tracking usage of CPU, memory, swap, and processesAbility to...
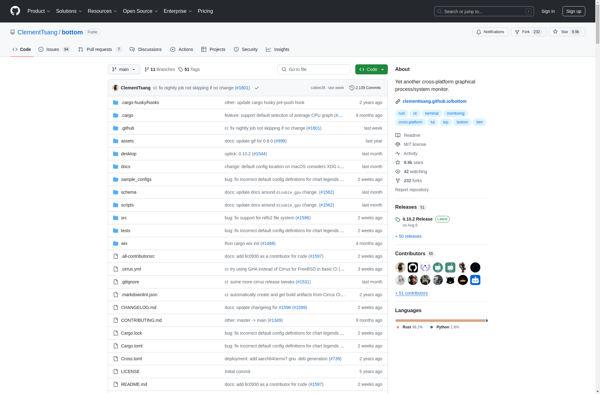
Bottom is a free, open-source voice chat software initially designed for Discord. It provides enhanced audio quality and customization options compared to Discord's built-in voice chat.Some key features of Bottom include:Spatial audio for more immersive soundNoise suppression for reducing background noiseCustomizable user interface with themes and pluginsCross-platform support for Windows,...