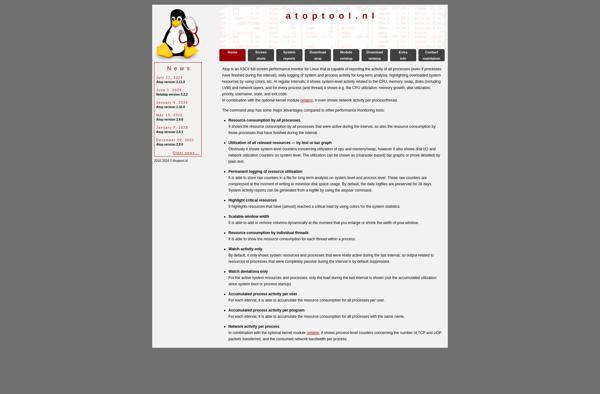
Atop is an open-source monitoring tool for monitoring and managing various server resources like CPU, memory, disk, network and processes. It can monitor in real-time and also log data for long-term analysis.
Atop is an open-source monitoring tool for monitoring and managing various server resources like CPU, memory, disk, network and processes. It can monitor in real-time and also log data for long-term analysis.
What is Atop?
Atop is an open-source monitoring tool for Linux systems used to monitor and manage various server resources including CPU, memory, disk drives, network and processes in real-time. It can show both the current status as well as long term statistics of these resources.
Some key features of Atop include:
Real-time monitoring of CPU, memory, disk, network, swap usage/performance.
Logger mode to log data for long-term analysis.
Interactive interface to inspect load on processes, disks.
Alerts based on various thresholds.
Easy visualization of data using ASCII graphs.
Log rotation based on time or file size.
Supports various outputs like ASCII, raw data or HTTP publish.
Atop is useful for system administrators and developers to monitor system resources, performance and troubleshoot bottle necks. It provides more detailed statistics compared to basic tools like top, vmstat or iostat. The logging features also help correlate performance data with events.
Atop Features
Features
Real-time monitoring of server resources like CPU, memory, disk, network, processes
Alerting based on configured thresholds
Historical data logging for long-term analysis
Visualization of resource usage and performance metrics
Command line and web interface
Customizable dashboards and graphs
Export monitoring data to CSV files
Pricing
Open Source
Pros
Open source and free
Lightweight and low resource usage
Easy installation and configuration
Good for troubleshooting performance issues
Flexible alerting and notification options
Works on Linux and Unix-like systems
Cons
Limited built-in graphing and dashboard capabilities
Steep learning curve for advanced features
No official support offered
Requires familiarity with Linux/Unix systems
Not designed for large scale or enterprise monitoring
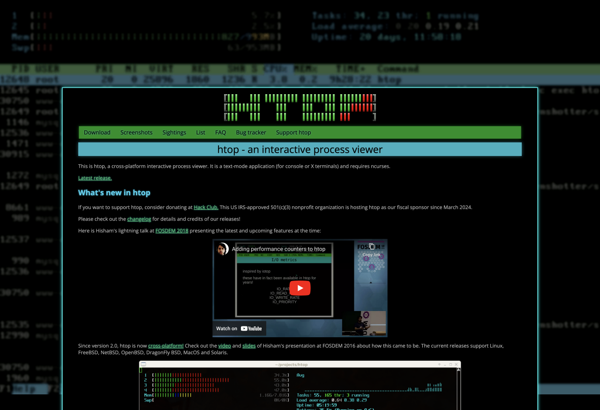
htop is an open source, cross-platform interactive process viewer for Linux systems. It aims to provide a more user-friendly interface to view and interact with running processes than the default top utility included with most Linux distributions.Some key features of htop include:Color-coded rows and columns to easily identify process states...
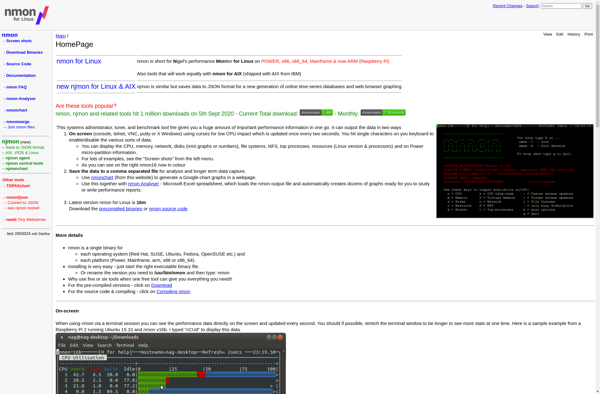
nmon is a powerful and popular system monitor tool developed by IBM specifically for the AIX and Linux operating systems. It is used to monitor CPU, memory, network, disks, file systems and other system performance parameters in real time.Some key features of nmon include:Monitors CPU, memory, disks, network, file systems,...
IPtraf-ng is an open-source command-line network monitoring utility for Linux systems. It allows administrators to gather detailed statistics about network traffic flowing through an interface.Some of the information IPtraf-ng can display includes:IP traffic and packet statisticsTCP and UDP connections and packet countsICMP activitiesOSPF neighbor informationInterface statisticsIPtraf-ng has an interactive, menu-driven...
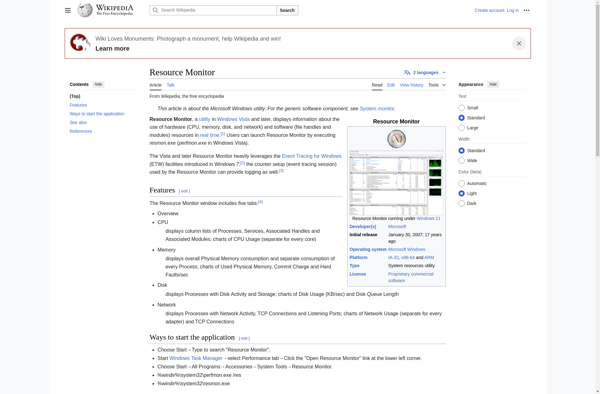
Resource Monitor is a utility included in modern versions of Microsoft Windows that enables users to view detailed usage information about key hardware components and resources. It provides real-time graphs and metrics related to CPU, memory, disk, and network usage.With Resource Monitor, users can pinpoint programs and processes that may...
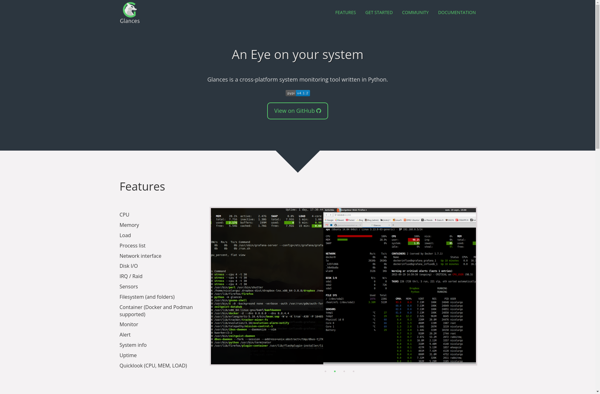
Glances is an open source, cross-platform system monitoring tool written in Python. It allows you to monitor your system's key metrics like CPU, memory, disks, network, and processes in real-time through a curses or web interface.Some key features of Glances include:Real-time overview of system resources utilizationMinimal dependencies and easy to...
Iotop is an open source command line utility found in Linux operating systems that provides detailed monitoring of disk I/O usage by processes running on the system. It displays information in a table showing process IDs (PIDS), process names, the type of I/O (read or write), the amount of data...
psutil is a cross-platform library for retrieving information on running processes and system utilization in Python. It provides an simple, easy-to-use interface for monitoring different aspects of your system, both software-related and hardware-related.Some key features of psutil include:Retrieving comprehensive information on running processes like name, PID, memory and CPU usage,...
Bashtop is a text-based system monitoring tool for Linux that runs directly in the terminal. It provides detailed, real-time information on key system resources like the CPU, memory, processes, network traffic, and disks/storage.Some of the key features of Bashtop include:CPU usage statistics - individual core usage, frequency, temperatureMemory and swap...
Sternum is an open-source product analytics platform that can be self-hosted. It provides similar functionality to commercial solutions like Mixpanel and Amplitude.With Sternum, you can track user events and behavior within your web or mobile application to understand how users are interacting with your product. This allows you to identify...
libstatgrab is an open-source library written in C that allows programs to easily query key system statistics. It provides a cross-platform interface to access information about CPU usage, memory usage, disk usage, network traffic, uptime, and more on Linux, BSD, macOS, Solaris and other Unix-like operating systems.Some key features of...