Cardbox - 3D Box Visualization
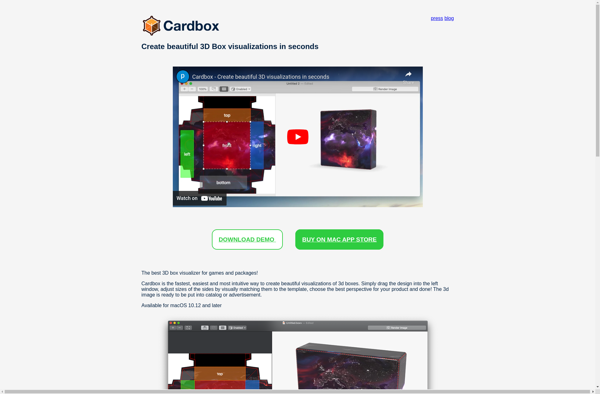
Cardbox: 3D Box Visualization Software
Interactive 3D data visualization for box plots and histograms, with customizable datasets and trend spotting capabilities
What is Cardbox - 3D Box Visualization?
Cardbox is an innovative data visualization software used to create interactive 3D box plots, histograms, scatter plots, and more. It provides an intuitive drag-and-drop interface to upload datasets and build customizable graphs that can be rotated, zoomed, and explored from different angles.
Key features include:
- Upload CSV/Excel files to visualize data
- Generate 3D graphs like box plots, histograms, scatter plots
- Customize graph colors, labels, box opacity and whisker display
- Animate and rotate graphs in real-time
- Spot trends, patterns and statistical outliers
- Export images and embed graphs into presentations
- Collaboration tools to share visualizations
With its focus on 3D box plots and histograms, Cardbox allows users to spot outliers and gain a deeper perspective into the distribution of data. The vivid visualizations make it easy to uncover insights. Users can customize the look and feel of graphs to create clean, presentation-ready visuals. Images and interactive visualizations can also be exported and shared with others.
Overall, Cardbox brings interactive 3D graphics to statistical analysis and makes it fast and easy to uncover fresh perspectives in data.
Cardbox - 3D Box Visualization Features
Features
- 3D box plots
- 3D histograms
- Interactive graphs
- Customizable graphs
- Upload datasets
- Spot trends and outliers
Pricing
- Free
- Subscription-Based
Pros
Cons
Official Links
Reviews & Ratings
Login to ReviewNo reviews yet
Be the first to share your experience with Cardbox - 3D Box Visualization!
Login to ReviewThe Best Cardbox - 3D Box Visualization Alternatives
Top Data Visualization and 3D Visualization and other similar apps like Cardbox - 3D Box Visualization
Here are some alternatives to Cardbox - 3D Box Visualization:
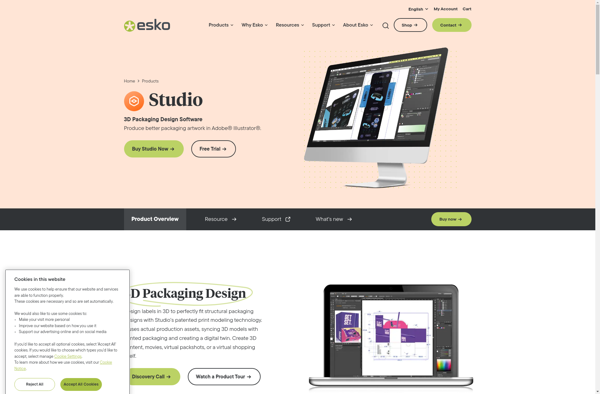
Suggest an alternative ❐Esko Studio
IC3D
LiveSurface
Luxwan Boxshot 3D
