Jesubi
Jesubi is an open-source business intelligence and data visualization software. It provides an intuitive drag-and-drop interface to create interactive dashboards, charts, and reports. Key features include data connectivity, calculation engine, and scheduling capabilities.
Jesubi: Open-Source Business Intelligence & Data Visualization Software
Intuitive drag-and-drop interface for creating interactive dashboards, charts, and reports, with features like data connectivity, calculation engine, and scheduling capabilities.
What is Jesubi?
Jesubi is an open-source business intelligence and data visualization tool for creating interactive dashboards, charts, and reports. It features an easy-to-use drag-and-drop interface that allows users without technical skills to quickly analyze data and share insights.
Key capabilities and benefits of Jesubi include:
- Intuitive visual interface to visualize data from multiple sources including SQL, NoSQL, cloud apps, and flat files
- In-memory calculation engine to transformations and mashup data from different sources
- Drag-and-drop components to create interactive dashboards with advanced charts, tables, filters, and KPIs
- Pixel-perfect print reports
- Parameterized reporting and scheduled distribution of reports
- Role-based access control to provide specific viewership and editing rights
- APIs and embed options to integrate dashboards into other apps
- Open-source tool with active community support and contributions
With its user-friendly approach, Jesubi enables organizations to unlock insights from data without coding. It is an ideal platform for data analysis and reporting needs of companies.
Jesubi Features
Features
- Drag-and-drop interface to create dashboards
- Interactive charts and reports
- Data connectivity and ETL
- Calculation engine
- Scheduling and alerts
Pricing
- Open Source
Pros
Open source and free
Intuitive and easy to use
Great for ad-hoc analysis and visualization
Active community support
Cons
Limited built-in data sources
Less advanced features than paid BI tools
Steep learning curve for advanced use cases
Official Links
Reviews & Ratings
Login to ReviewThe Best Jesubi Alternatives
Top Business & Commerce and Business Intelligence & Analytics and other similar apps like Jesubi
Here are some alternatives to Jesubi:
Suggest an alternative ❐Salesforce
Salesforce is a cloud-based customer relationship management (CRM) platform that helps businesses connect with customers, partners, and employees. It was founded in 1999 and has become the world's #1 CRM platform with over 150,000 companies using it.Key features of Salesforce include:Contact Management - Organize contact details for people and companies...
Pipedrive
Pipedrive is a cloud-based customer relationship management (CRM) software designed specifically for small to medium sized sales teams. It provides tools to manage the entire sales pipeline - from tracking leads to closing deals.Some key features of Pipedrive include:Deal pipelines - visualize and track deals through customizable pipelinesLead management -...
Streak CRM
Streak CRM is a cloud-based customer relationship management (CRM) platform designed specifically for small businesses. Some key features of Streak CRM include:Contact Management - Organize contact details for leads and customers including names, companies, email addresses, phone numbers, locations, and custom fields.Interaction Tracking - Log emails, calls, meetings, notes, and...
Mautic
Mautic is an open source marketing automation platform used by companies to nurture leads and contacts through personalized campaigns. Its key features include:Lead tracking - Track website visitors across devices and channels to understand their journey.Contact monitoring - Segment contacts based on attributes, behaviors, and engagement levels.Campaign builder - Visually...
SuiteCRM
SuiteCRM is an open-source customer relationship management (CRM) software designed for businesses of all sizes. Based on the popular CRM platform SugarCRM, SuiteCRM continues to incorporate the latest innovations and best practices to help companies manage customer relationships.Some key features of SuiteCRM include:Contact Management - Organize all your prospect and...
Zoho CRM
Zoho CRM is a feature-rich customer relationship management (CRM) platform designed for businesses of all sizes. It helps streamline sales, marketing, customer support, and overall customer engagement processes in one easy-to-use system.Key features of Zoho CRM include:Contact management - Organize all your customer and prospect contact details and interactions in...
SugarCRM
SugarCRM is an open-source customer relationship management (CRM) platform designed for sales, marketing, and support teams to organize, track, and communicate with customers and sales leads. First launched in 2004 by SugarCRM Inc, SugarCRM aims to provide an affordable and flexible alternative to proprietary CRM suites.Some key features of SugarCRM...
EspoCRM
EspoCRM is an open source customer relationship management (CRM) application designed for small and medium sized businesses. It allows companies to organize, track, and manage interactions with leads and customers across sales, marketing, customer service, and other business processes.Key features of EspoCRM include:Contact Management - Store names, companies, emails, addresses,...
CiviCRM
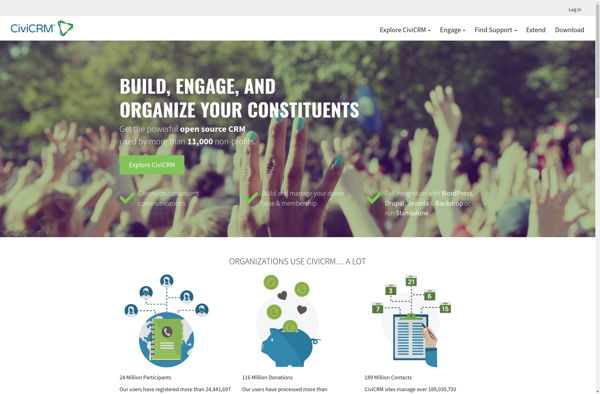
CiviCRM is an open source constituent relationship management (CRM) software designed specifically for non-profit and civic organizations. It helps these organizations manage relationships with constituents, including donors, activists, volunteers, paid staff, affiliate organizations, and the communities they serve.Some of the key features of CiviCRM include:Contact Management - Comprehensively track details...
Insightly
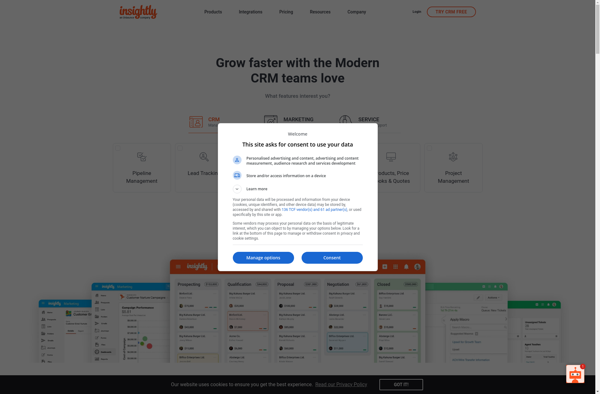
Insightly is a cloud-based customer relationship management (CRM) platform designed for small and medium businesses. It aims to provide an easy-to-use system to organize contacts, track communications history, manage leads and opportunities, schedule tasks and events, and gain insights from reports and analytics.Key features of Insightly CRM include:Contact management -...
Salesflare
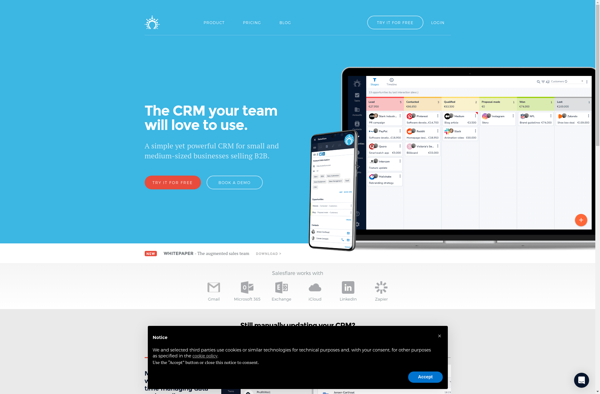
Salesflare is a comprehensive sales engagement platform designed to help B2B sales teams manage relationships, automate outreach, and track sales activity across the entire sales funnel. Some key features of Salesflare include:Lead and account data integration from your CRMIntelligent email sequencing that automatically follows up with leadsReal-time alerts when prospects...
Jetpack CRM
Jetpack CRM is a cloud-based customer relationship management (CRM) platform designed specifically for small businesses. It aims to provide an affordable, easy-to-use solution to help small teams organize their contacts, improve communication, manage deals and pipeline, and analyze data to grow sales.Key features of Jetpack CRM include:Contact Management - Organize...
