Table & Map
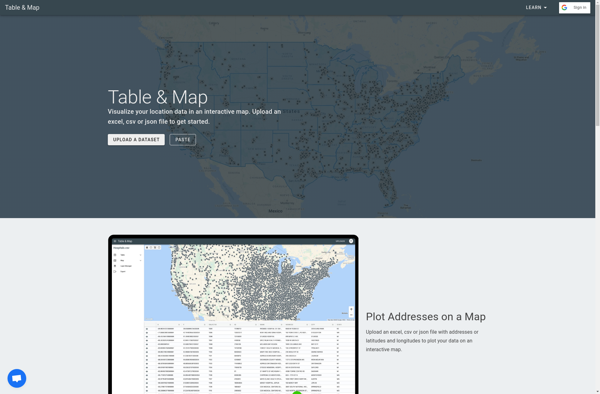
Table & Map: Data Visualization Software
Table & Map is a data visualization software that allows users to create interactive maps, charts, dashboards and reports. It has drag-and-drop functionality to build visualizations easily without coding.
What is Table & Map?
Table & Map is a versatile business intelligence and data visualization software used by companies, organizations and individuals to analyze data and create insightful visualizations. It provides an easy-to-use interface for non-technical users to build interactive dashboards, reports, charts and maps.
Some key features of Table & Map include:
- Drag-and-drop interface to create visualizations like tables, bar charts, line charts, pie charts, scatter plots, pivot tables, geospatial maps etc. without coding
- Connect to various data sources such as Excel, CSV files, databases, cloud apps via API
- Collaboration tools to share dashboards and visualizations with other users
- Customizable templates and themes to brand reports and dashboards
- Scheduled report distribution to automatically send reports via email or slack
- Access control to manage user permissions
- Works on web browser so users can access it from any device or operating system
Table & Map is trusted by various companies and teams across industries like retail, finance, healthcare, education etc. It makes data accessible to everyone in the organization so they can make quick data-driven decisions. The software reduces dependency on IT teams for building reports and visualizations.
Table & Map Features
Features
- Interactive maps and charts
- Drag-and-drop data visualization builder
- Dashboard and report creation
- Data import from various sources
- Collaboration and sharing tools
Pricing
- Freemium
- Subscription-Based
Pros
Cons
Official Links
Reviews & Ratings
Login to ReviewThe Best Table & Map Alternatives
View all Table & Map alternatives with detailed comparison →
Top Office & Productivity and Data Visualization and other similar apps like Table & Map
No alternatives found for Table & Map. Why not suggest an alternative?